Fig. 5.
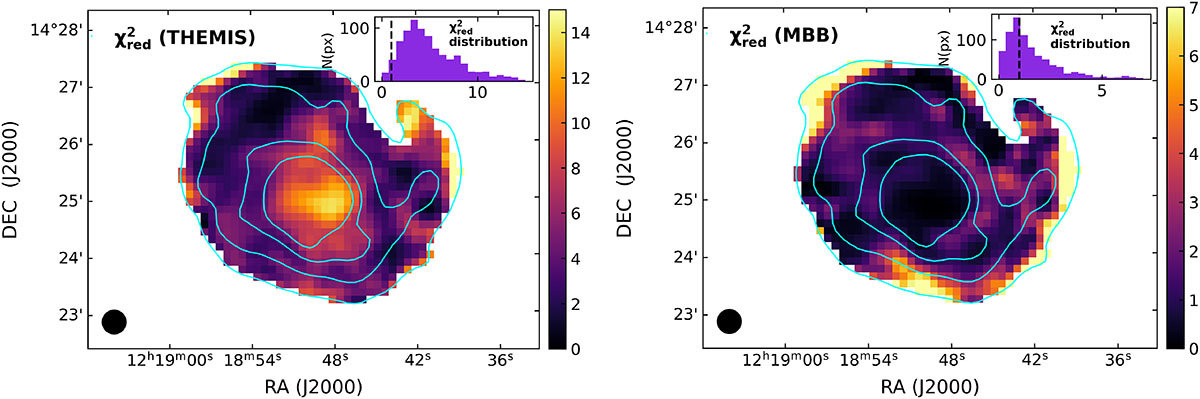
Download original image
Pixel-by-pixel χred2 maps at 25″ resolution; bottom-left corner). Left panel: χred2 from the NIR-to-radio SED fitting with THEMIS. Right panel: χred2 from the FIR-to-radio (λ ≥ 100 μm) SED fitting with a single-T MBB. Insets show the χred2 distribution. The dashed black vertical lines indicate a χred2 = 1. Solid cyan lines represent the SPIRE 350 μm contours at [5, 15, 35, 55]×σ.
Current usage metrics show cumulative count of Article Views (full-text article views including HTML views, PDF and ePub downloads, according to the available data) and Abstracts Views on Vision4Press platform.
Data correspond to usage on the plateform after 2015. The current usage metrics is available 48-96 hours after online publication and is updated daily on week days.
Initial download of the metrics may take a while.