Fig. 7.
Download original image
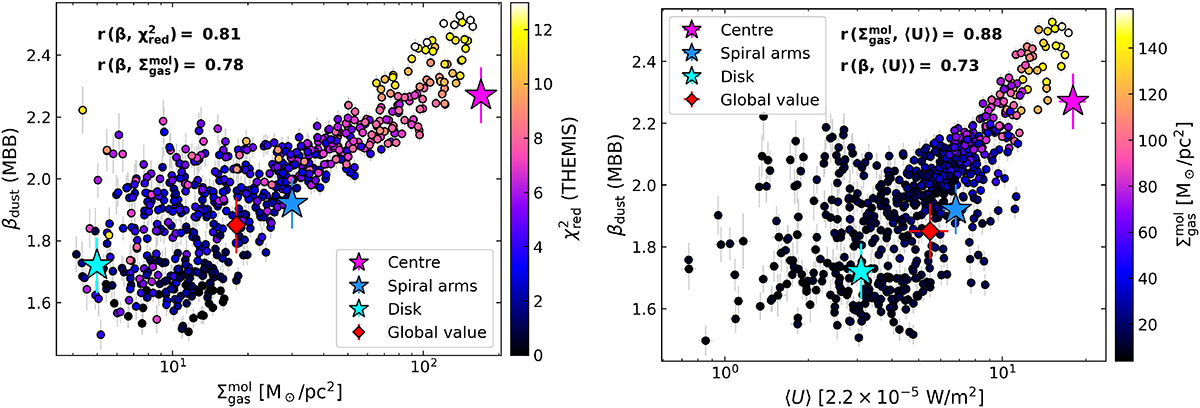
Dust spectral index β from the pixel-by-pixel single-T MBB fit versus the molecular gas surface density, ![]() (left panel), and the average ISRF, ⟨U⟩ (right panel). Each point represents an 8″ ∼ 560 pc pixel, colour-coded by THEMIS χred2 (left) or
(left panel), and the average ISRF, ⟨U⟩ (right panel). Each point represents an 8″ ∼ 560 pc pixel, colour-coded by THEMIS χred2 (left) or ![]() (right). Analysis is limited to pixels within the CO(1–0) mask (Fig. B.4); angular resolution is 25″. Pearson correlation coefficients (r) are shown at the top. Filled stars mark the centre (magenta), spiral arms (blue), and disc (cyan) regions (Sect. 4.2); the red diamond indicates integrated values over the whole galaxy (Sect. 4.1).
(right). Analysis is limited to pixels within the CO(1–0) mask (Fig. B.4); angular resolution is 25″. Pearson correlation coefficients (r) are shown at the top. Filled stars mark the centre (magenta), spiral arms (blue), and disc (cyan) regions (Sect. 4.2); the red diamond indicates integrated values over the whole galaxy (Sect. 4.1).
Current usage metrics show cumulative count of Article Views (full-text article views including HTML views, PDF and ePub downloads, according to the available data) and Abstracts Views on Vision4Press platform.
Data correspond to usage on the plateform after 2015. The current usage metrics is available 48-96 hours after online publication and is updated daily on week days.
Initial download of the metrics may take a while.