Fig. 8.
Download original image
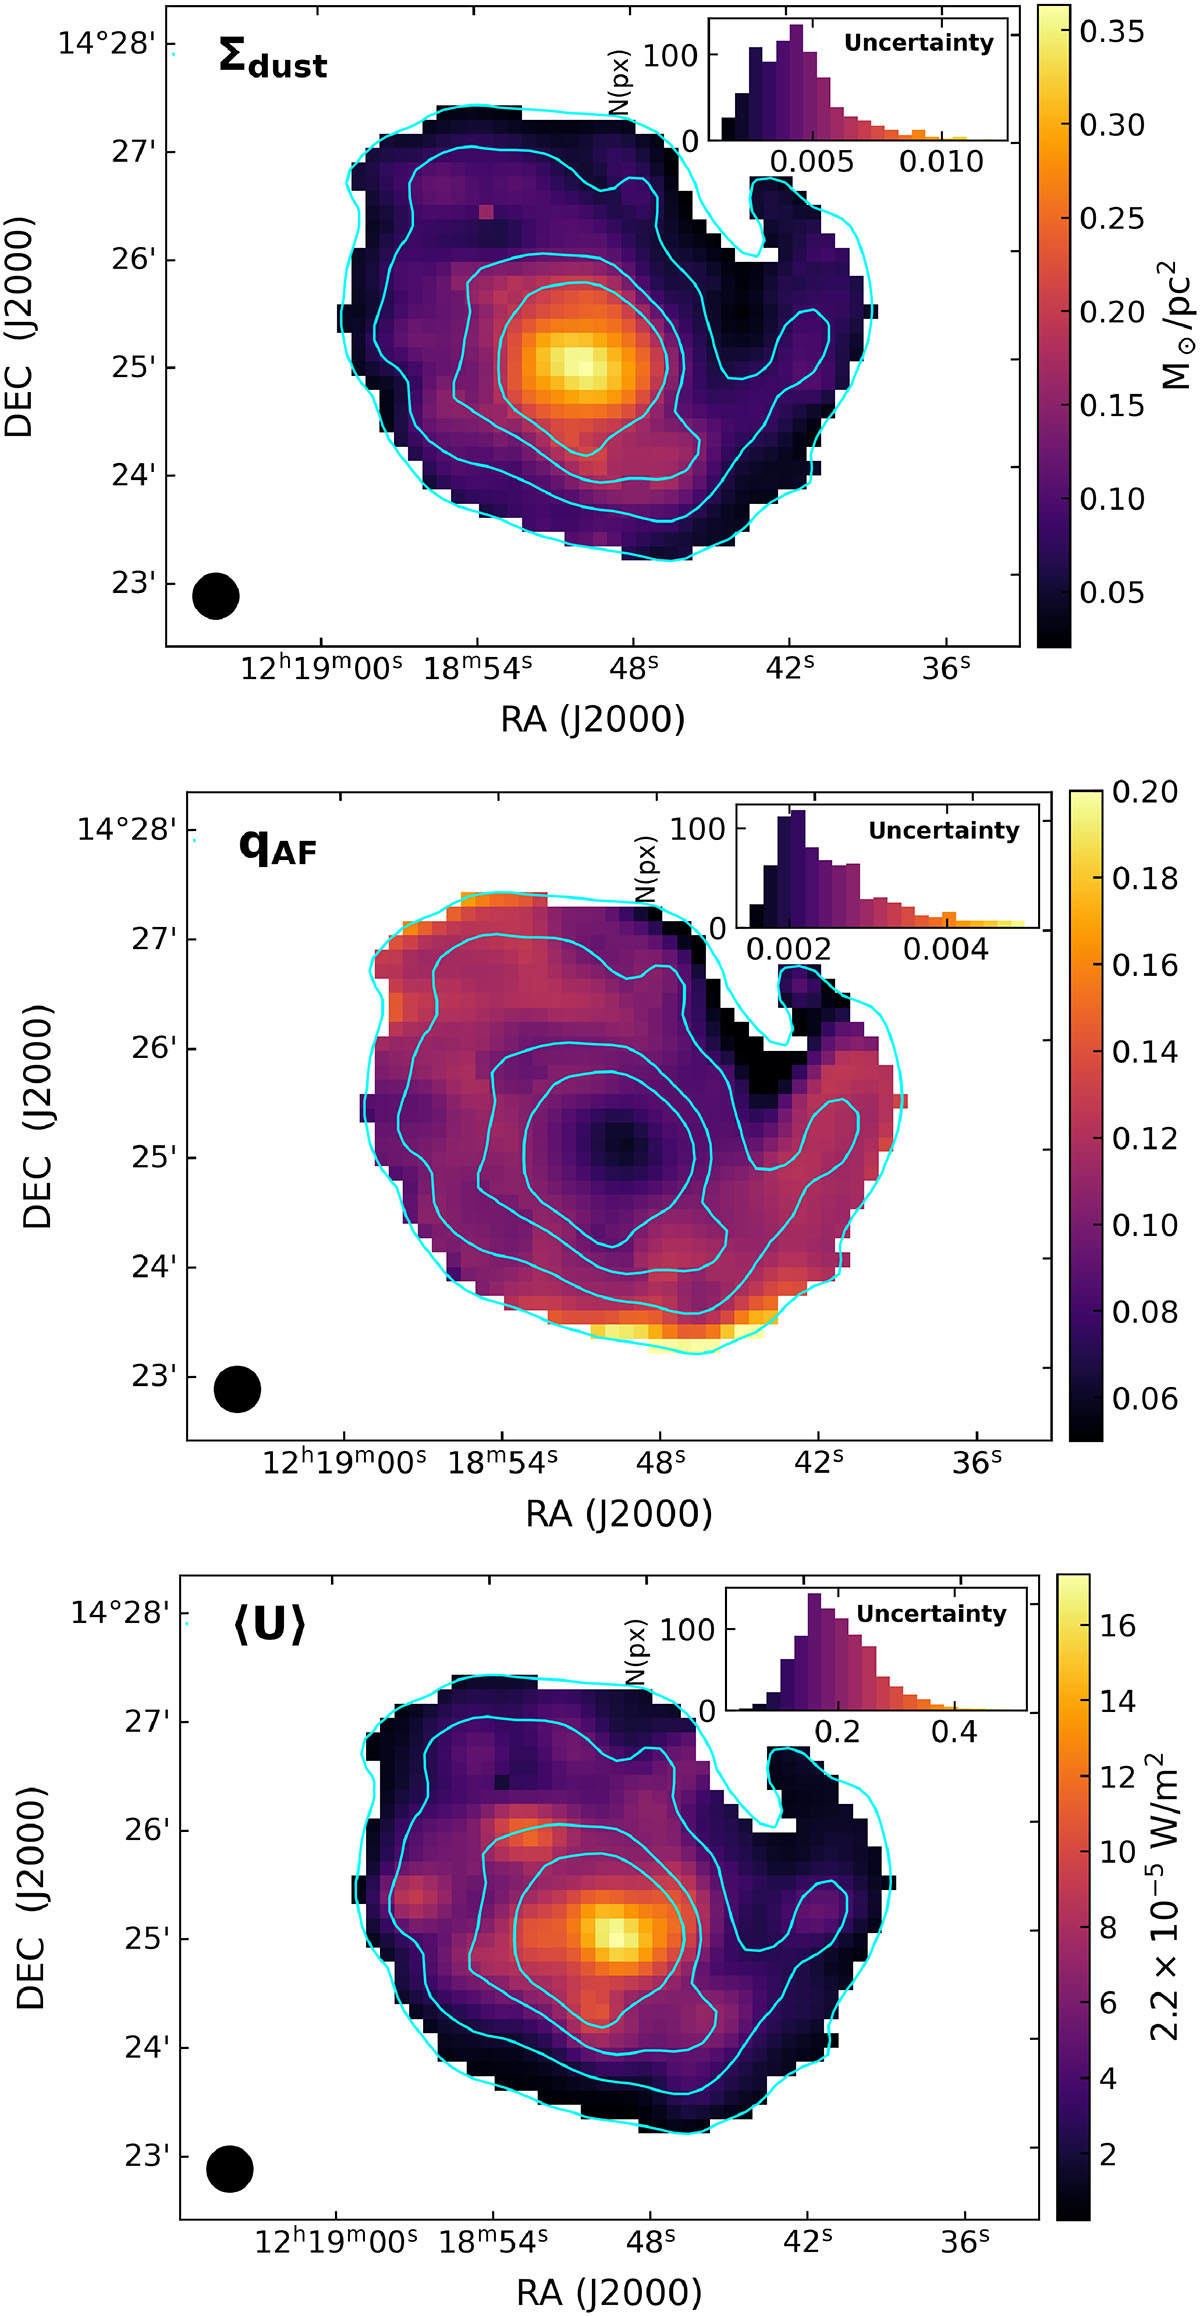
Pixel-by-pixel maps at 25″ resolution of: the dust mass surface density, Σdust (top); small grain fraction, qAF (middle); and average interstellar radiation field, ⟨U⟩ (bottom), from the THEMIS fit. SPIRE 350 μm contours at [5, 15, 35, 55]×σ are overlaid in cyan. Insets show the corresponding uncertainty distributions and use the same colour-coding as in the maps.
Current usage metrics show cumulative count of Article Views (full-text article views including HTML views, PDF and ePub downloads, according to the available data) and Abstracts Views on Vision4Press platform.
Data correspond to usage on the plateform after 2015. The current usage metrics is available 48-96 hours after online publication and is updated daily on week days.
Initial download of the metrics may take a while.