Fig. 10
Download original image
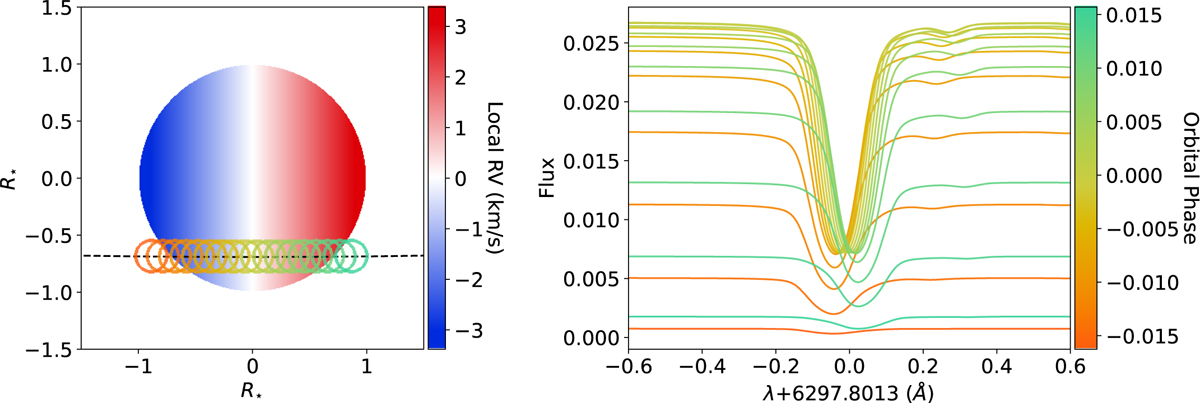
Orbital configuration and behind-the-planet local profiles of the 6297.8013 Å Fe I line for 11 August are shown simulated with SOAPv4. Left: representation of the stellar disc in terms of velocities, along with the position of the planet as a function of the observed orbital phases. Right: simulated behind-the-planet line profiles as a function of the orbital phase. The colours on the plot correspond to the phases and positions shown on the left plot.
Current usage metrics show cumulative count of Article Views (full-text article views including HTML views, PDF and ePub downloads, according to the available data) and Abstracts Views on Vision4Press platform.
Data correspond to usage on the plateform after 2015. The current usage metrics is available 48-96 hours after online publication and is updated daily on week days.
Initial download of the metrics may take a while.