Fig. A.2
Download original image
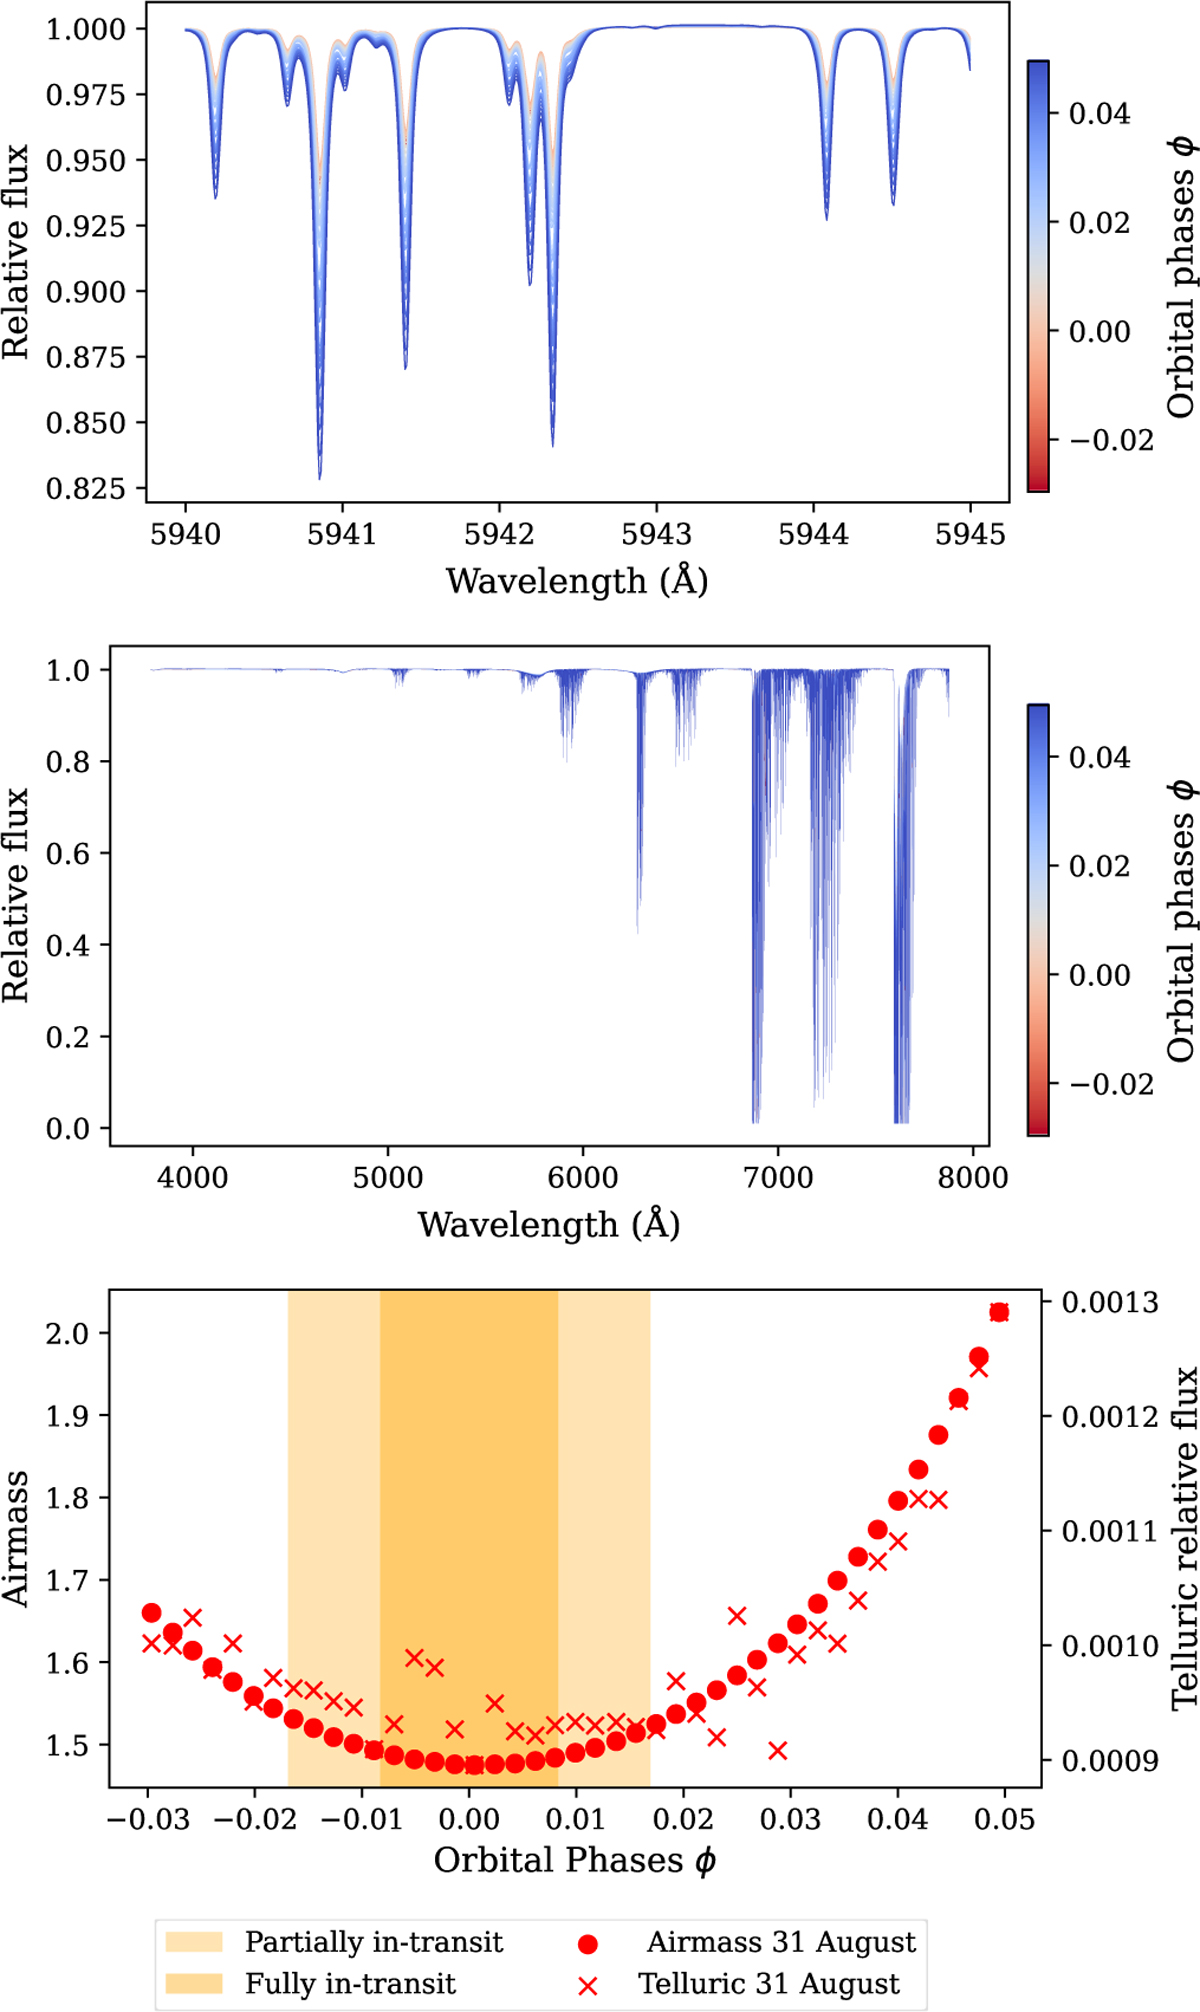
Top: Ratio of the uncorrected spectra over telluric-corrected spectra with Molecfit for 31 August 2021 with the same wavelength interval as in Figure 2. Middle: Zoomed-out section of the same telluric spectra as the top panel, the wavelength range covers the entire domain of ESPRESSO. Colour bar indicates the orbital phase of the corresponding spectra. Bottom: Airmass and mean flux of the telluric-corrected spectra minus uncorrected spectra between 436 nm and 686 nm (range of the Fe I line CCFs) as dots and crosses, respectively. The shaded region is the interval of transit with the ingress and egress being lighter.
Current usage metrics show cumulative count of Article Views (full-text article views including HTML views, PDF and ePub downloads, according to the available data) and Abstracts Views on Vision4Press platform.
Data correspond to usage on the plateform after 2015. The current usage metrics is available 48-96 hours after online publication and is updated daily on week days.
Initial download of the metrics may take a while.