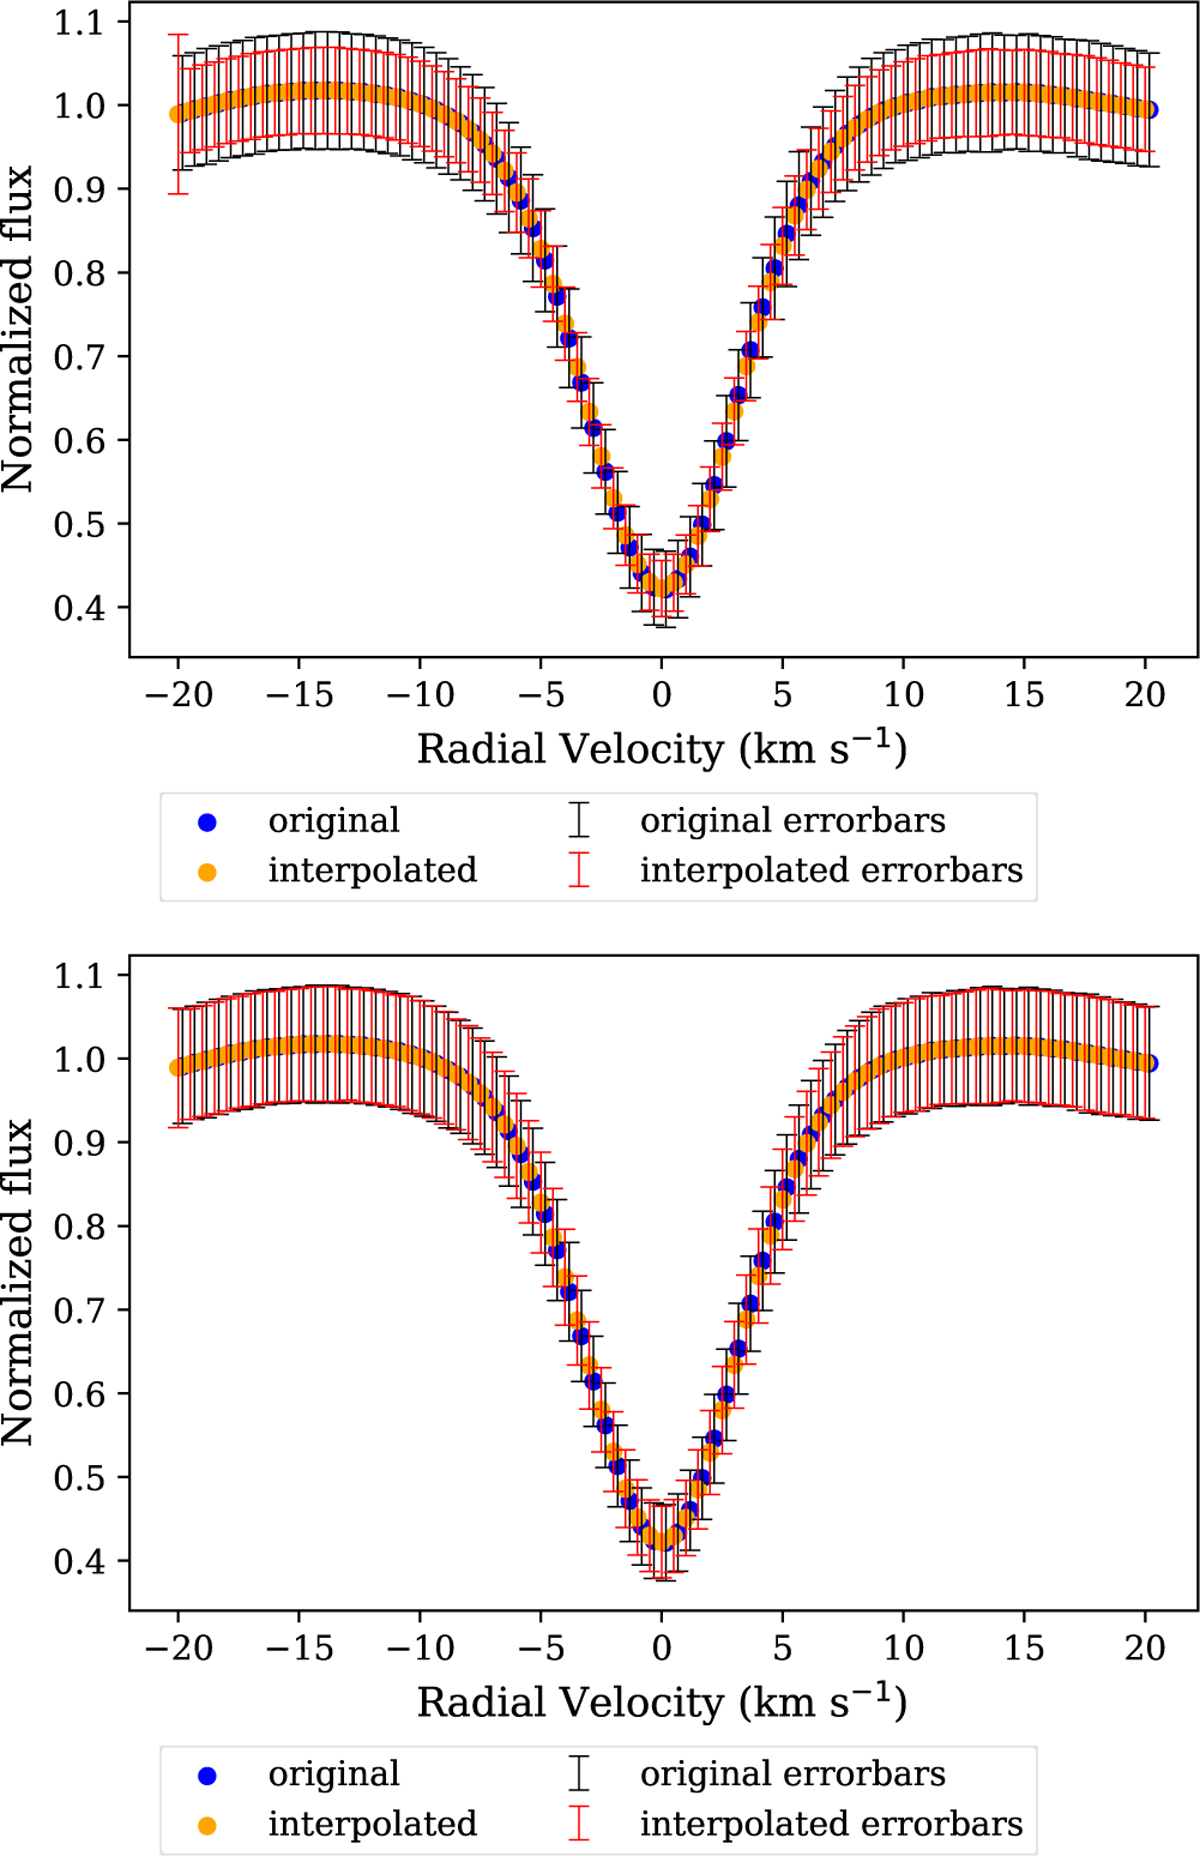
Fig. C.1
Download original image
Top: interpolation of a strong Fe I CCF without taking into account uncertainties using formula C.4. Bottom: same as the top except we consider covariances between points using formula C.5. The blue points are the CCF prior to interpolation, while orange is after interpolation. The black error bars are the uncertainties (square root of the diagonal of the covariance matrix) of the CCFs before interpolation with the red error bars being after interpolation. The uncertainties have been scaled up by a factor of 100 for ease of viewing.
Current usage metrics show cumulative count of Article Views (full-text article views including HTML views, PDF and ePub downloads, according to the available data) and Abstracts Views on Vision4Press platform.
Data correspond to usage on the plateform after 2015. The current usage metrics is available 48-96 hours after online publication and is updated daily on week days.
Initial download of the metrics may take a while.