Open Access
Fig. 2
Download original image
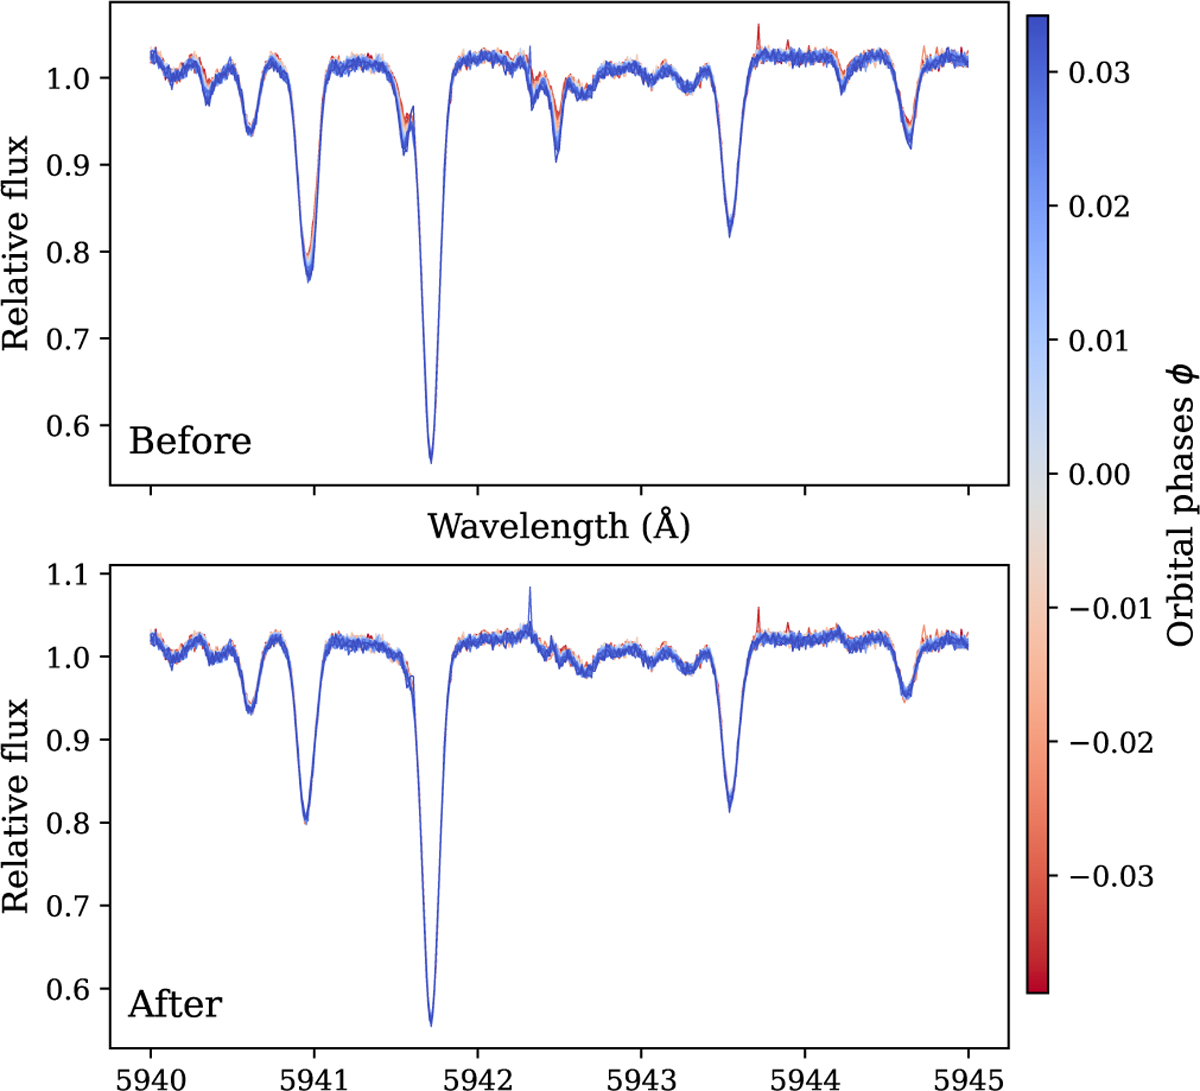
Comparison of the same section of the spectra (normalised to continuum) before (top) and after telluric correction with Molecfit (bottom). The colour bar represents the orbital phases of the corresponding spectra. The telluric lines can be seen varying in depth due to changes in airmass before the correction.
Current usage metrics show cumulative count of Article Views (full-text article views including HTML views, PDF and ePub downloads, according to the available data) and Abstracts Views on Vision4Press platform.
Data correspond to usage on the plateform after 2015. The current usage metrics is available 48-96 hours after online publication and is updated daily on week days.
Initial download of the metrics may take a while.