Fig. 3
Download original image
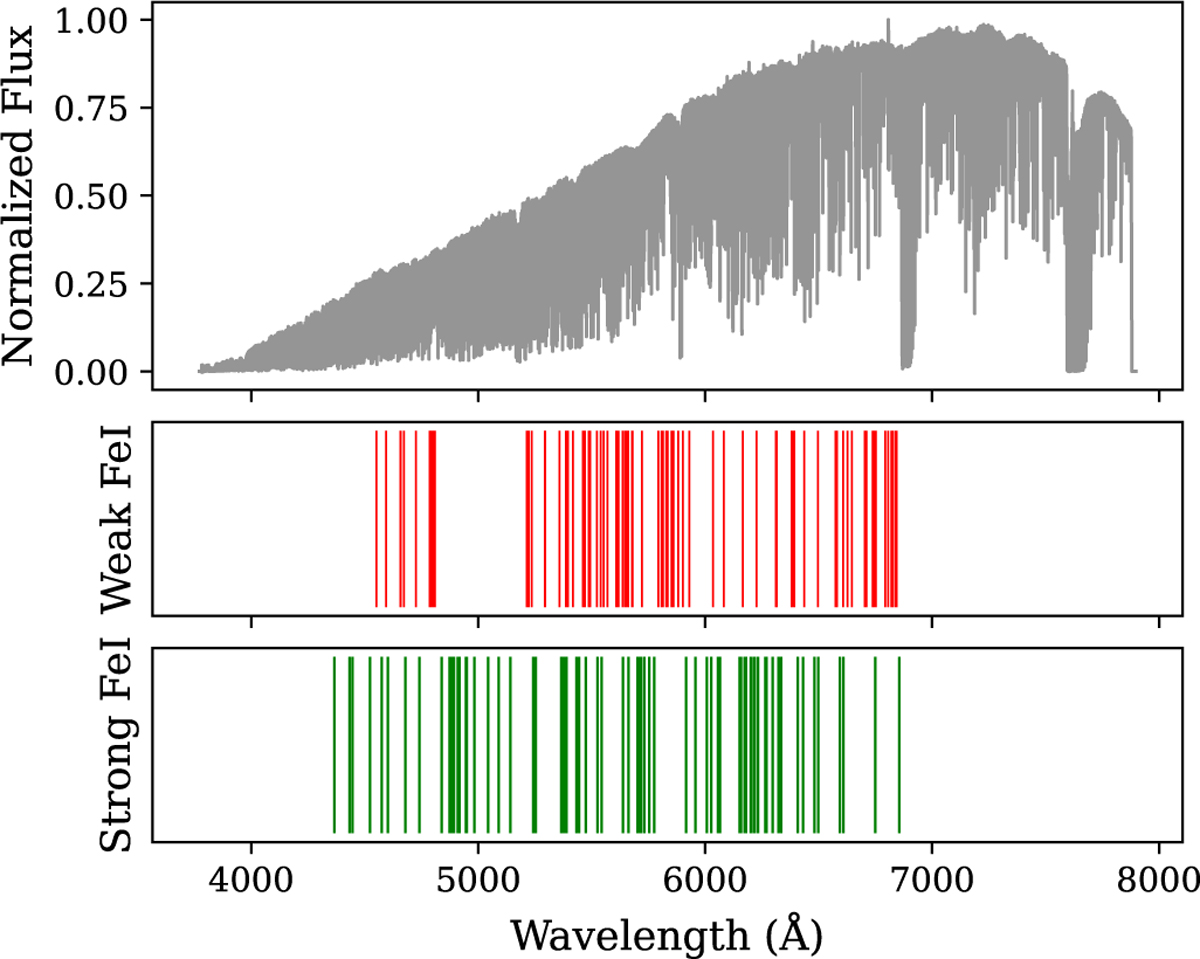
Spectral line positions of Fe I lines taken from Dravins et al. (2018) with one example spectrum (uncorrected for tellurics). Top: example spectrum shown in grey. Middle: wavelength positions of the weak Fe I lines shown as red vertical lines. Bottom: wavelength positions of the strong Fe I lines, shown as green vertical lines.
Current usage metrics show cumulative count of Article Views (full-text article views including HTML views, PDF and ePub downloads, according to the available data) and Abstracts Views on Vision4Press platform.
Data correspond to usage on the plateform after 2015. The current usage metrics is available 48-96 hours after online publication and is updated daily on week days.
Initial download of the metrics may take a while.