Fig. 5
Download original image
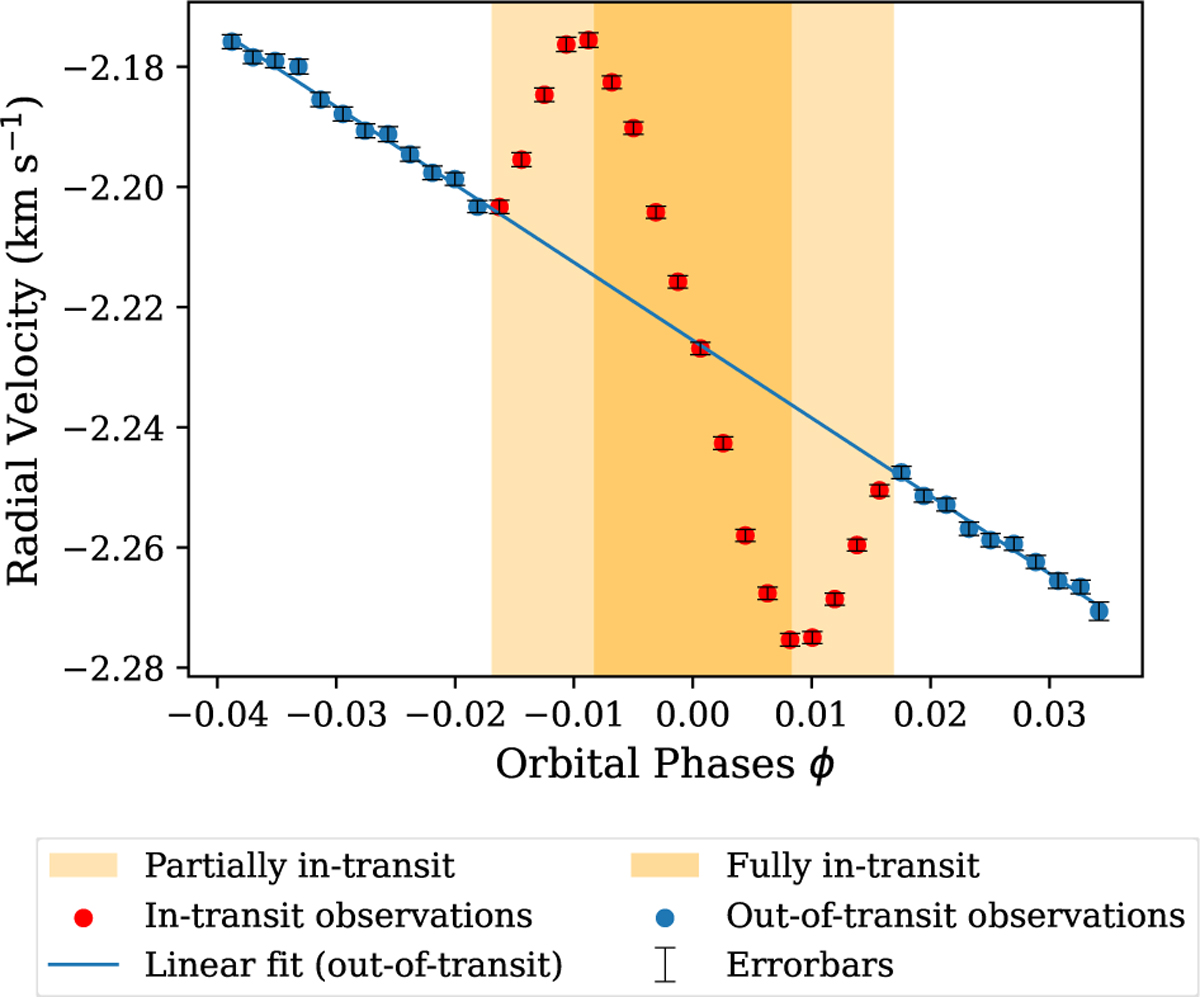
Radial velocities of the strong Fe I CCFs for the 11 of August 2021. The shaded area represents the time of transit, with the lighter sections representing the ingress and egress of the transit. The dots in red represent the in-transit observations, while blue represent out-of-transit observations. The blue line represents the linear fit to the motion of the star around its system’s barycentre.
Current usage metrics show cumulative count of Article Views (full-text article views including HTML views, PDF and ePub downloads, according to the available data) and Abstracts Views on Vision4Press platform.
Data correspond to usage on the plateform after 2015. The current usage metrics is available 48-96 hours after online publication and is updated daily on week days.
Initial download of the metrics may take a while.