Fig. 7
Download original image
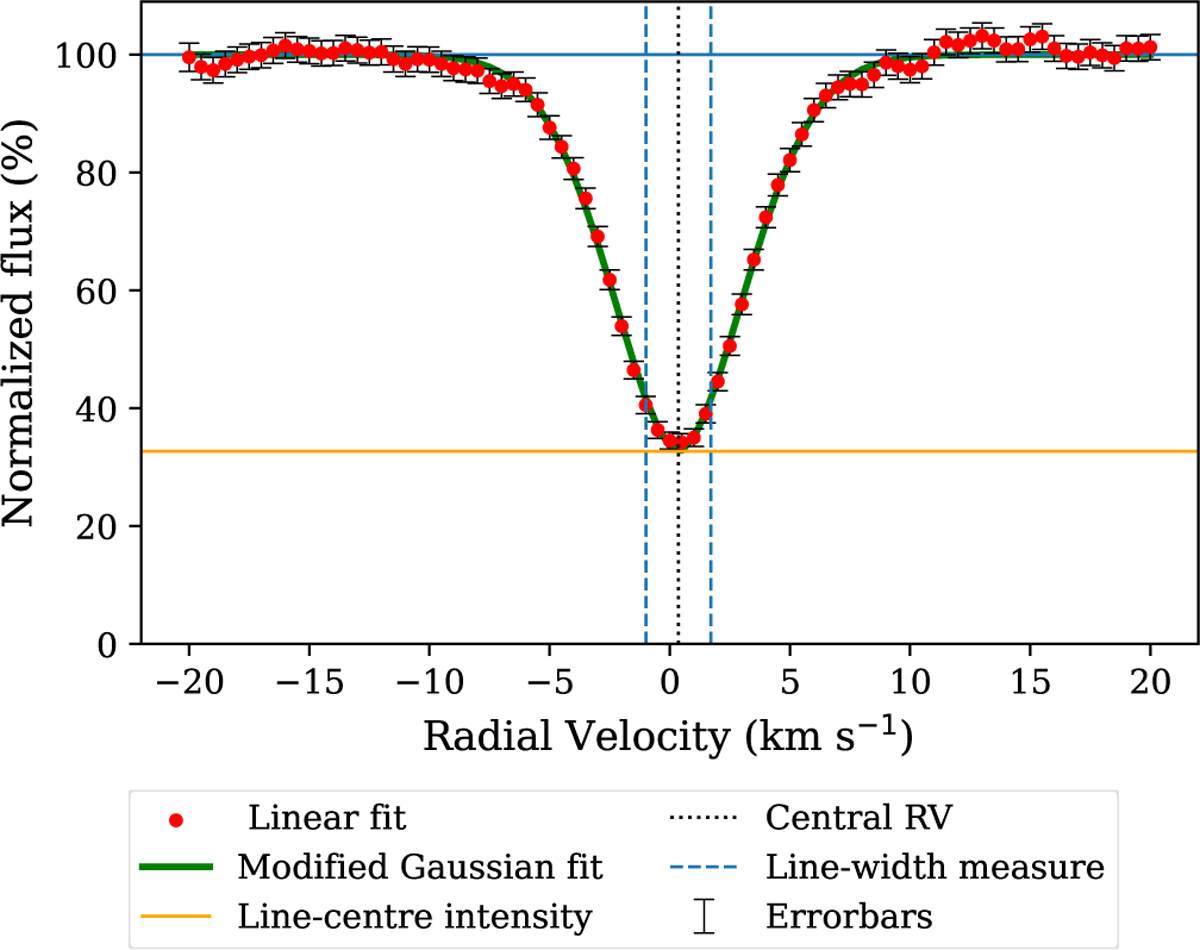
Example of a local CCF profile being fitted to a modified Gaussian function (see Eq. (1)). This specific example is one of the strong Fe I local CCFs at ϕ = 0.0157 on the first night. This fit gives parameters with values y0 = 0.02741 ± 0.0001, a = 0.0185 ± 0.0002, x0 = 0.36 ± 0.03 km/s, b = 2.71 ± 0.06 km/s, and c = 1.81 ± 0.07. The red dots represent the measurements of the local CCF profile, the green solid line is the modified Gaussian fit, the horizontal blue line denotes the continuum level, the yellow horizontal line is the value of the derived line-centre intensity, the vertical black dotted line is the value of the central radial velocity, and the distance between the two dashed vertical blue lines represents the line-width measure.
Current usage metrics show cumulative count of Article Views (full-text article views including HTML views, PDF and ePub downloads, according to the available data) and Abstracts Views on Vision4Press platform.
Data correspond to usage on the plateform after 2015. The current usage metrics is available 48-96 hours after online publication and is updated daily on week days.
Initial download of the metrics may take a while.