Fig. 8
Download original image
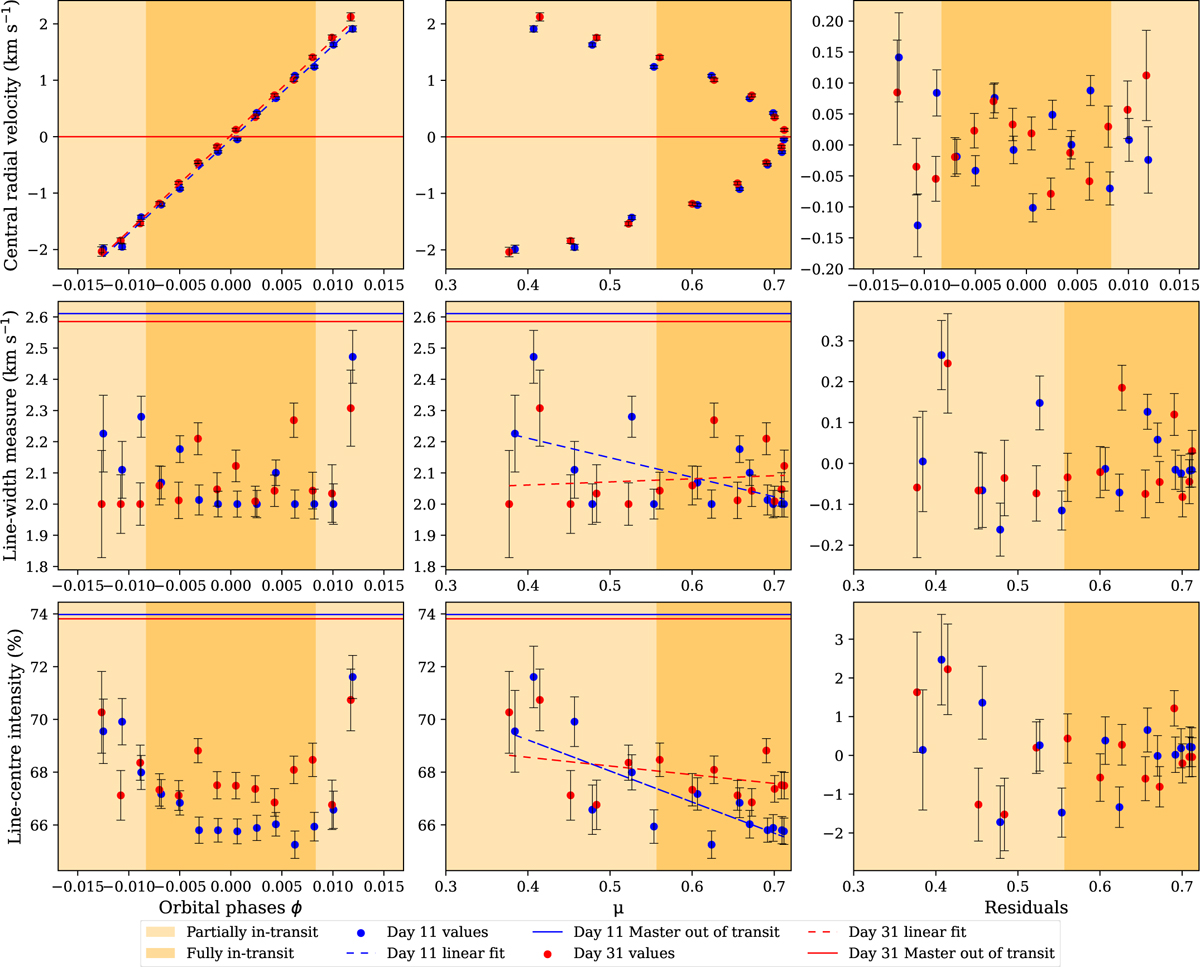
Datasets extracted from the local weak Fe I lines CCFs via function fitting, where the three quantities shown are represented in Fig. 7. The dots show the data points, the solid lines represent the values of the master out-of-transit and the dashed lines are linear fits to the data serving only as a visual guide. Features coloured in blue refer to data from the 11 August 2021, while red shows data from the 31 August 2021. Lastly the shaded area represents the time of transit with the lightly coloured region being the ingress and egress of the transit. The top row of panels shows the data for the central radial velocities of the local CCFs, the middle row shows the data regarding to the line-width measure and the bottom row shows the data for the line-centre intensity. The left column shows the multiple data points as a function of the respective orbital phases (ϕ), the middle column as a function of µ, and the right column shows the residuals of the linear fits performed.
Current usage metrics show cumulative count of Article Views (full-text article views including HTML views, PDF and ePub downloads, according to the available data) and Abstracts Views on Vision4Press platform.
Data correspond to usage on the plateform after 2015. The current usage metrics is available 48-96 hours after online publication and is updated daily on week days.
Initial download of the metrics may take a while.