Fig. 10
Download original image
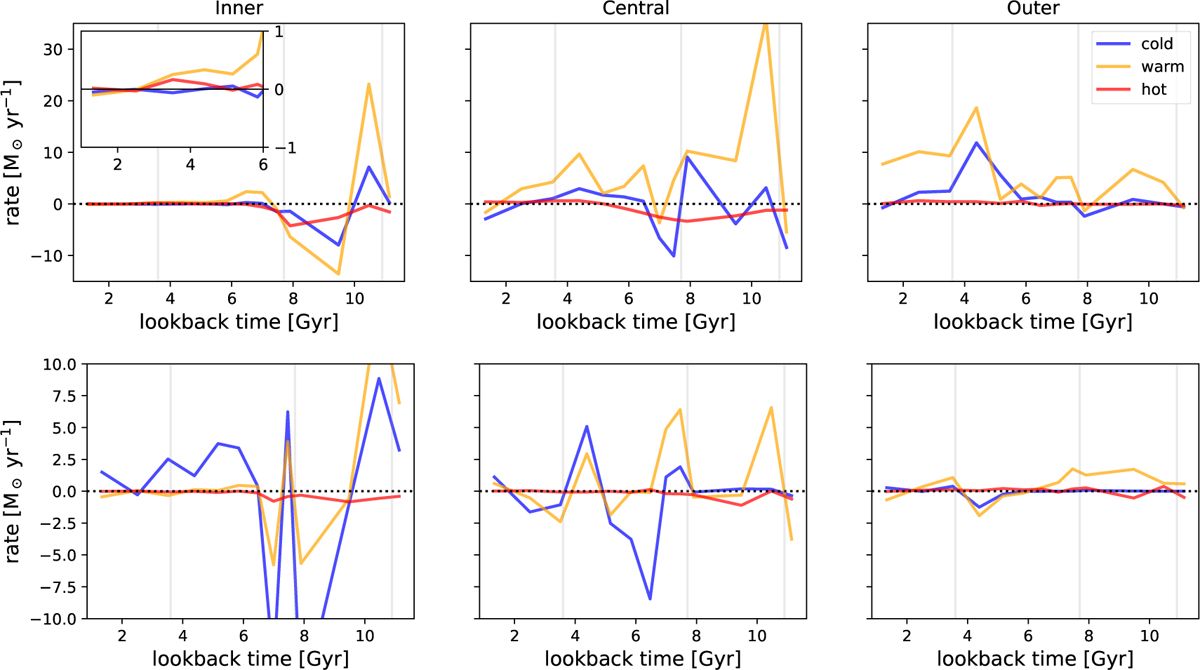
Vertical (top panels) and radial (bottom panels) net (inflow minus outflow) gas flow rates through an inner (0 < R (kpc) < 5), central (5 < R (kpc) < 16), and outer (16 < R (kpc) < 26) annular rings for cold (T (K) < 5 × 10³), warm (5 × 10³ < T (K) < 105, middle), and hot (T (K) > 105) gas. Positive net fluxes correspond to inflow (i.e. gas entering the corresponding ring), while negative values indicate gas outflow. The vertical lines in the panels indicate the lookback times (3.6, 7.7 and 10.9 Gyr ago) that separate the formation and evolution of the three disc phases identified in Romeo.
Current usage metrics show cumulative count of Article Views (full-text article views including HTML views, PDF and ePub downloads, according to the available data) and Abstracts Views on Vision4Press platform.
Data correspond to usage on the plateform after 2015. The current usage metrics is available 48-96 hours after online publication and is updated daily on week days.
Initial download of the metrics may take a while.