Fig. 11
Download original image
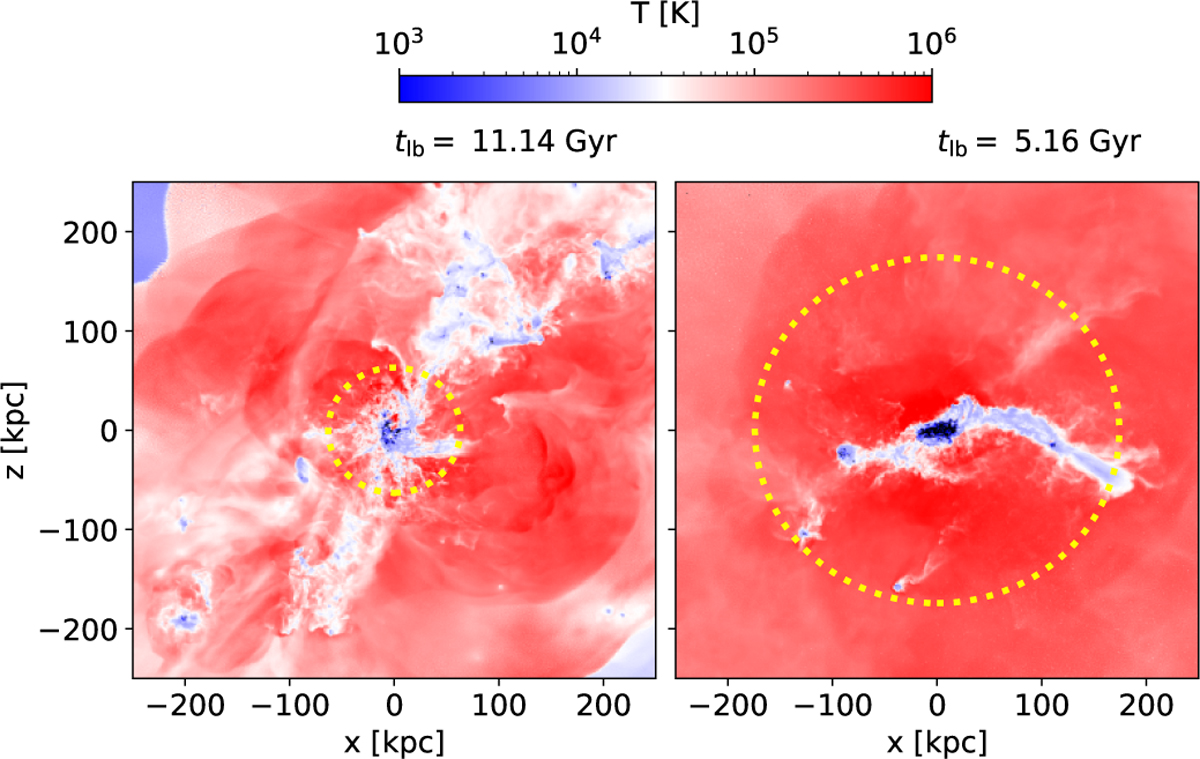
Gas temperature at different lookback times. These are number density-weighted profiles along the perpendicular direction, enhancing the visibility of underdense regions by reducing the dominance of high-density areas. The reference frames are aligned with the principal axes of Romeo at the last simulated snapshot. The yellow circle marks the virial radius, R200,c, at each time.
Current usage metrics show cumulative count of Article Views (full-text article views including HTML views, PDF and ePub downloads, according to the available data) and Abstracts Views on Vision4Press platform.
Data correspond to usage on the plateform after 2015. The current usage metrics is available 48-96 hours after online publication and is updated daily on week days.
Initial download of the metrics may take a while.