Fig. 12
Download original image
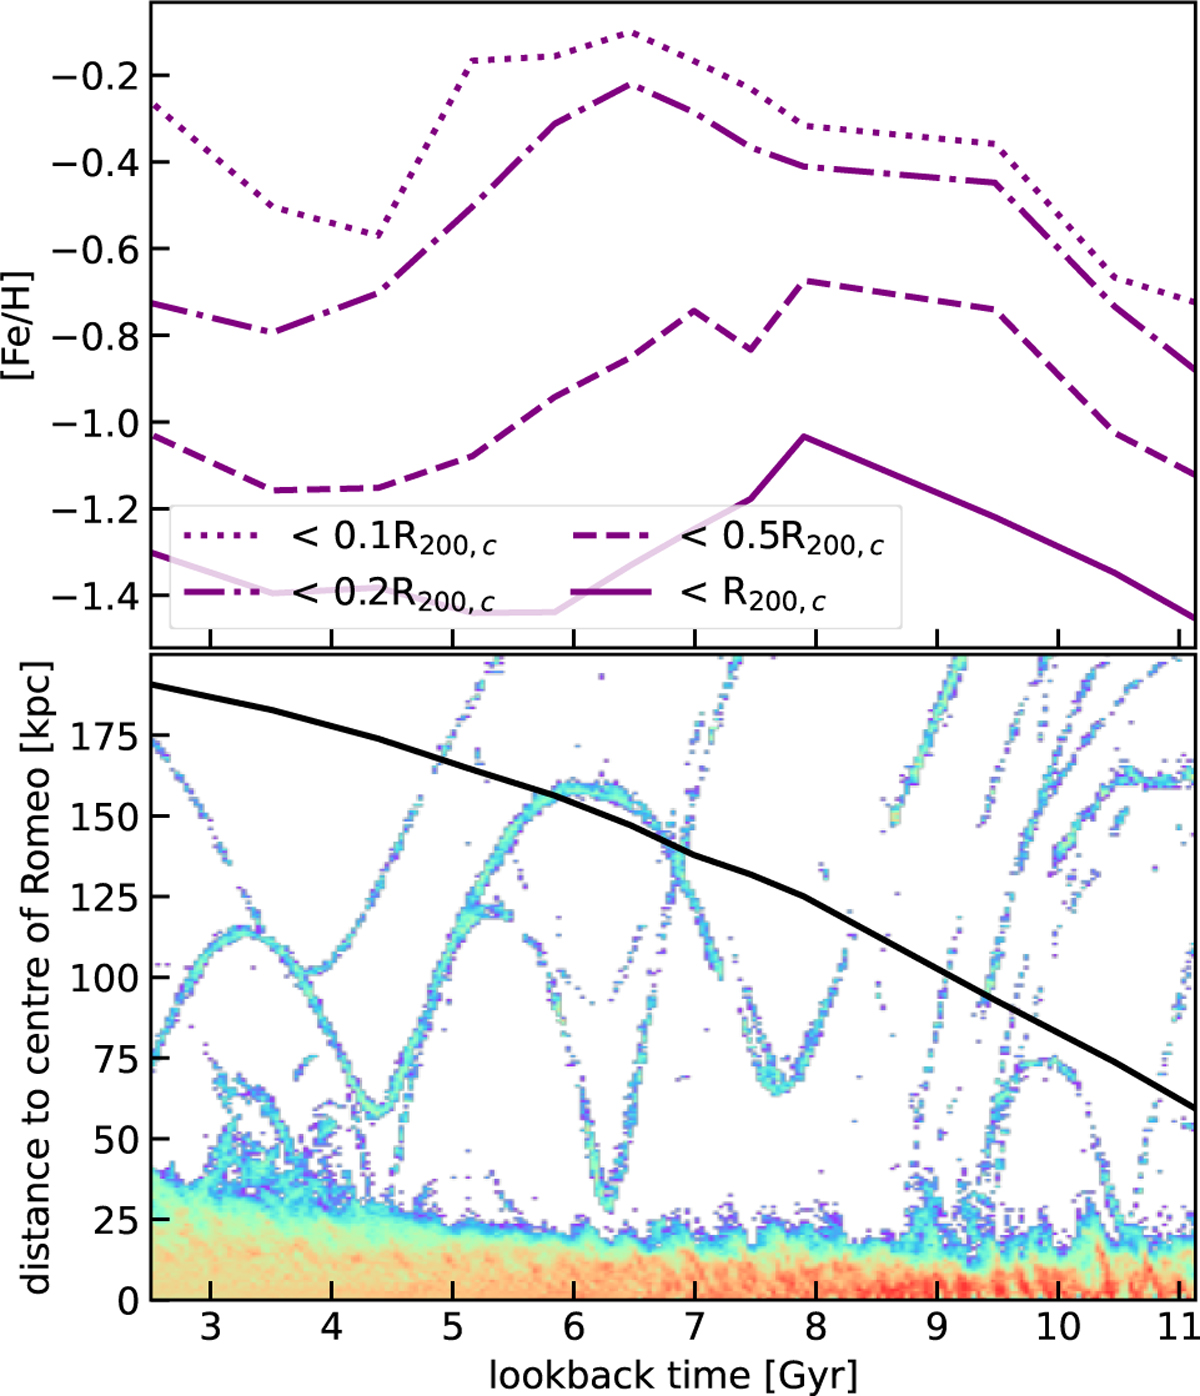
Top: time evolution of the mass-weighted [Fe/H] of the gaseous corona as a function of lookback time, with linestyles indicating the average metallicity within successive radial cuts (gas within |z| < 2 kpc was excluded to avoid contamination from the disc): r ≤ 0.1R200,c, r ≤ 0.2R200,c, r ≤ 0.5R200,c, and the entire corona. Bottom: density of forming stars as a function of formation time (x-axis) and galactocentric radius r (y-axis), with red indicating higher and blue lower densities. This highlights both the inside-out growth of the disc and the orbits of gas-rich merger events. The black line traces the virial radius R200,c as a function of look-back time.
Current usage metrics show cumulative count of Article Views (full-text article views including HTML views, PDF and ePub downloads, according to the available data) and Abstracts Views on Vision4Press platform.
Data correspond to usage on the plateform after 2015. The current usage metrics is available 48-96 hours after online publication and is updated daily on week days.
Initial download of the metrics may take a while.