Open Access
Fig. A.2
Download original image
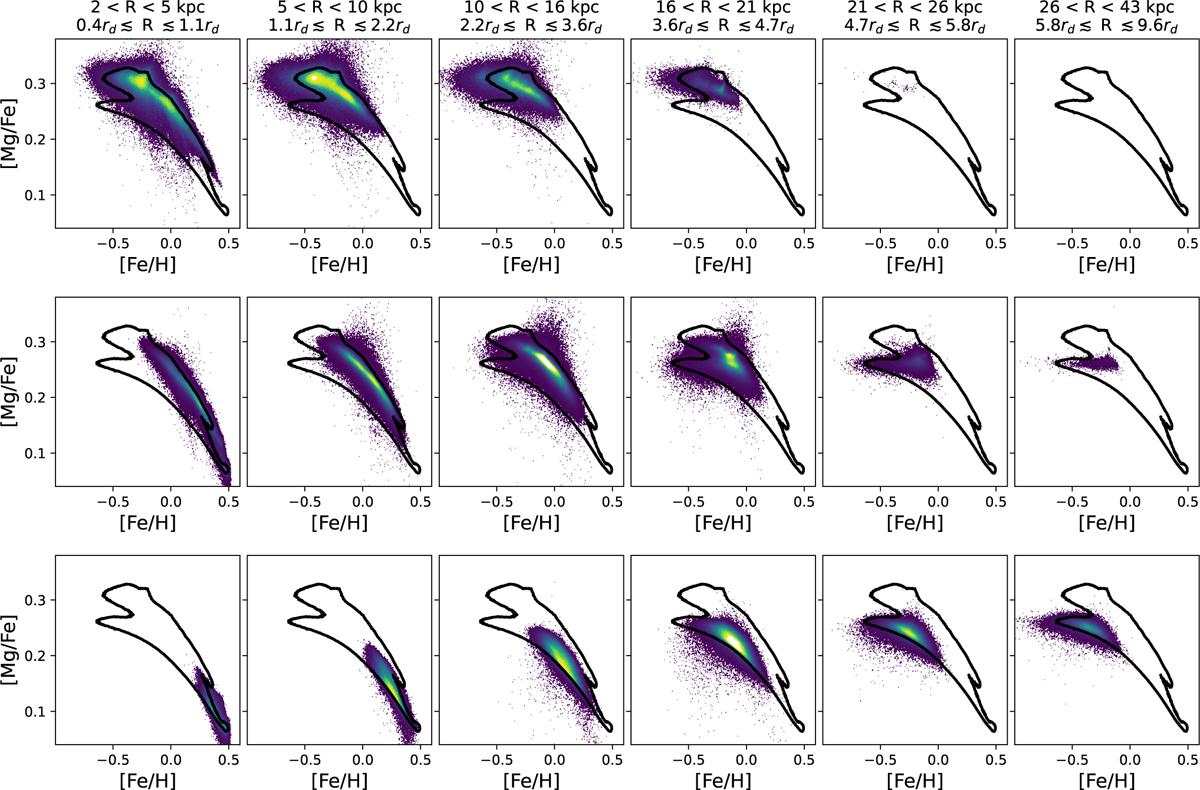
Number density for the high-α (top), bridge (middle) and low-α (bottom) discs. The 2D histograms in each row are scaled by the largest amplitude among the six subplots in that row. In this way, the galactocentric distances at which each disc component is most prominent can be seen.
Current usage metrics show cumulative count of Article Views (full-text article views including HTML views, PDF and ePub downloads, according to the available data) and Abstracts Views on Vision4Press platform.
Data correspond to usage on the plateform after 2015. The current usage metrics is available 48-96 hours after online publication and is updated daily on week days.
Initial download of the metrics may take a while.