Fig. 4
Download original image
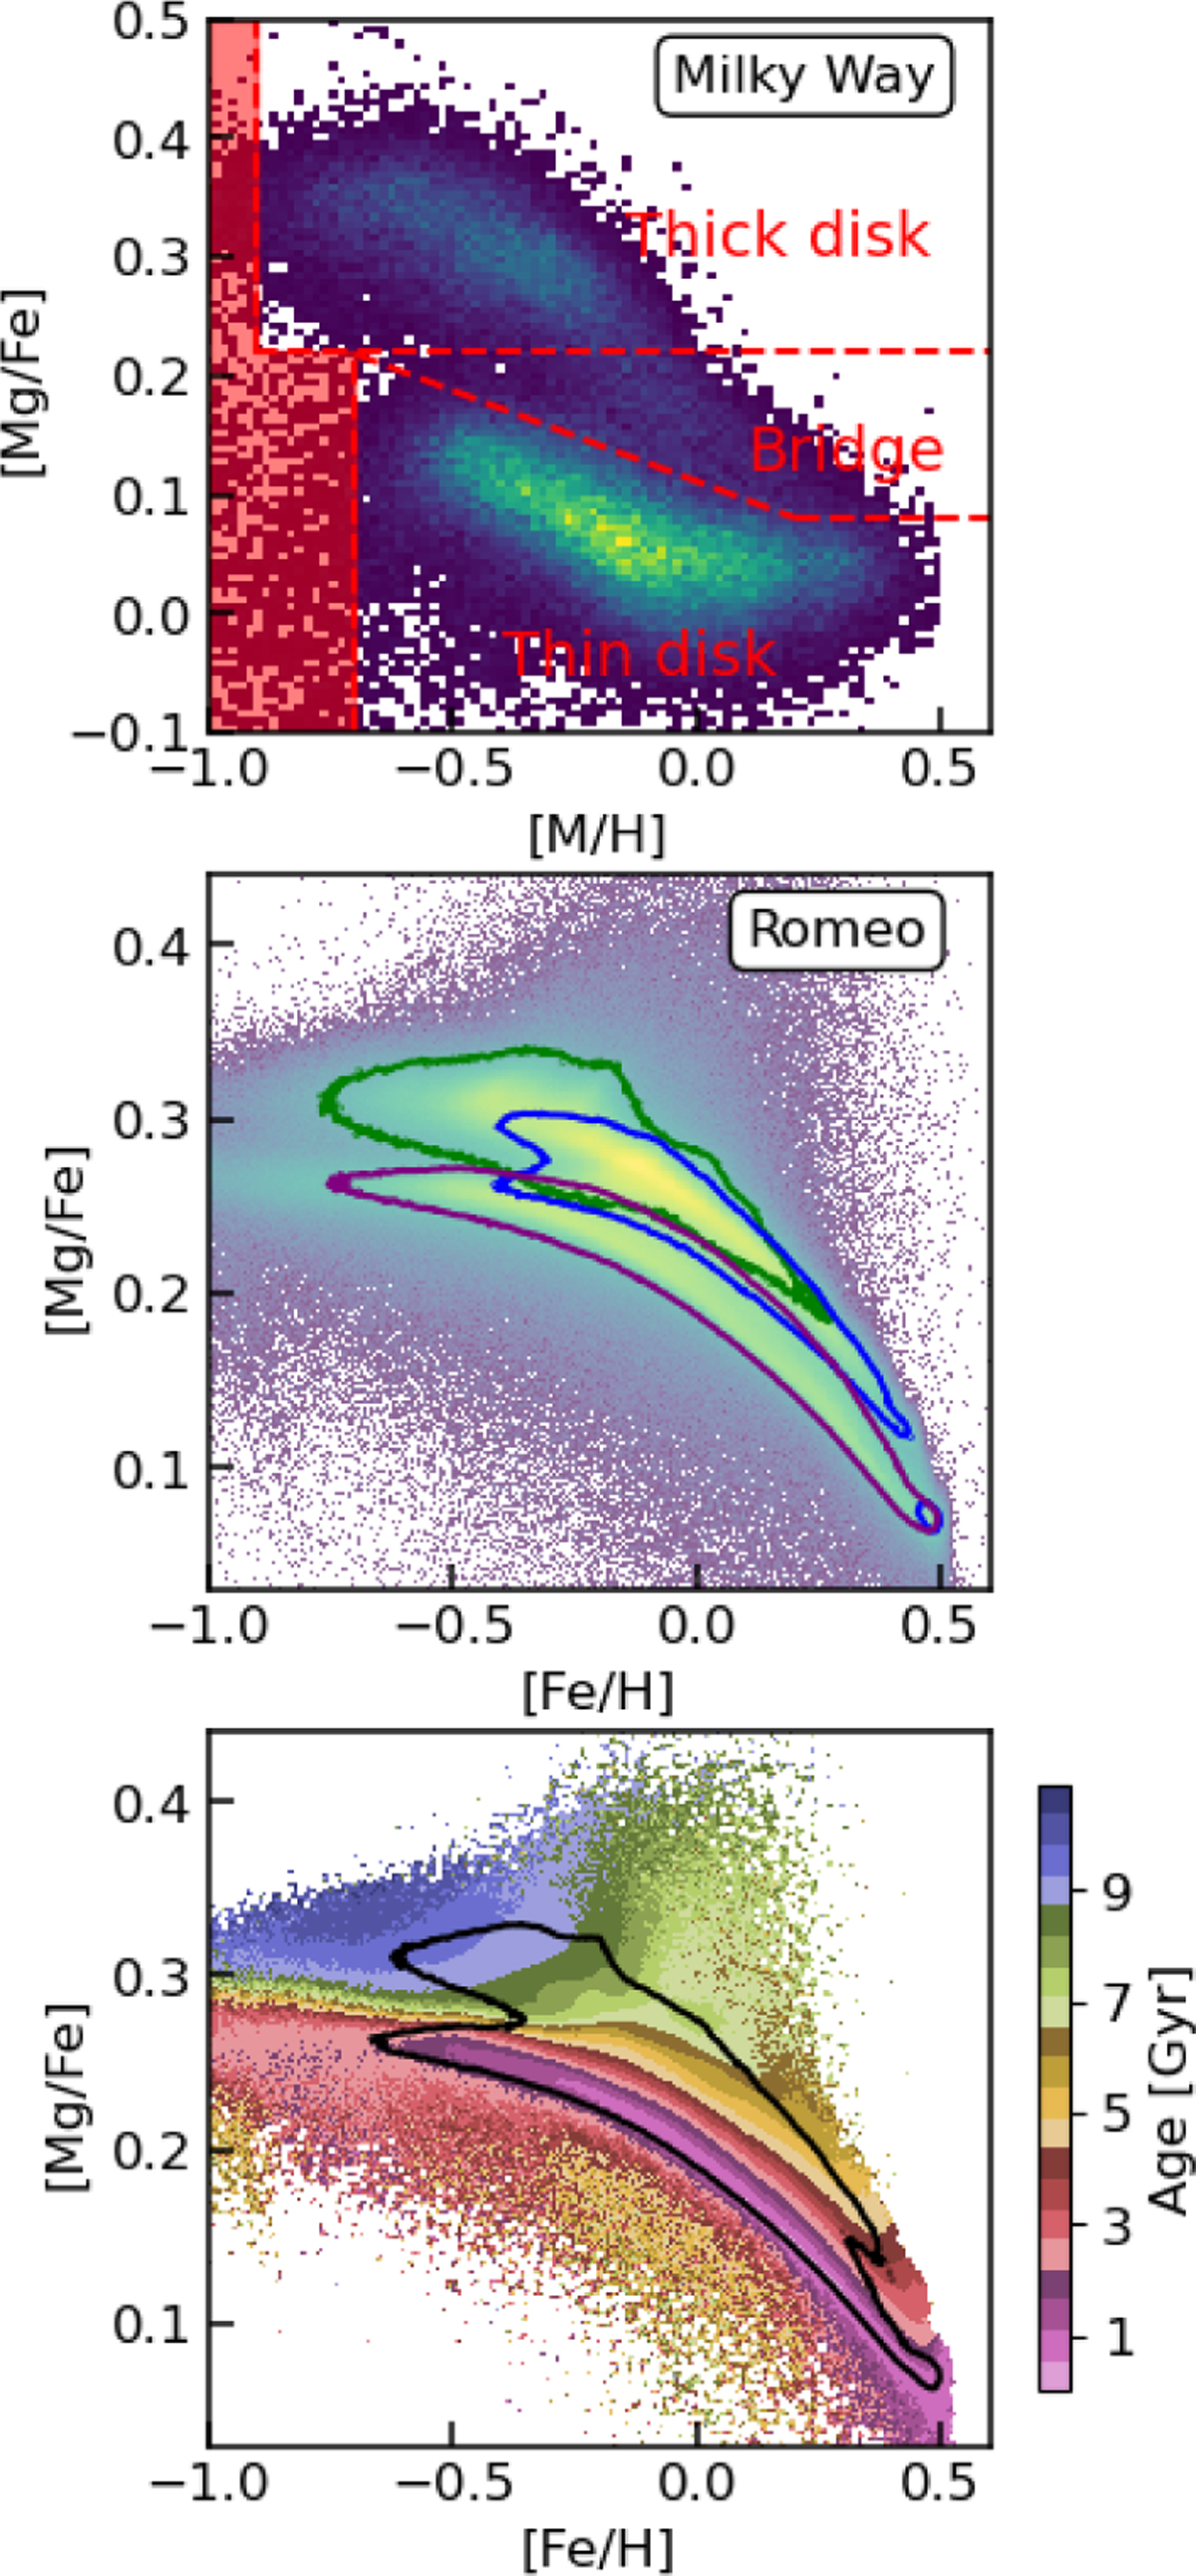
Top panel: 2D number density of a sample of giants in Gaia DR3 cross-matched with APOGEE DR17 that spanned a Galactocentric range of 4–16 kpc (see text for details). The red dashed lines delimit the thick-disc, bridge-, low-α regions used to derive the kinematic properties in Table 2, while the excluded region for this derivation is shaded red. Middle panel: 2D number density of star disc particles, as identified by GMM, in the [Mg/Fe] vs [Fe/H] plane. Green, blue and purple mark the contours containing 90% of the high-α, bridge and low-α disc stars, respectively. Bottom panel: mean age distribution of disc stars in the same plane, with the black contour enclosing the region containing 90% of the star particles in the disc. The last two panels show disc star particles at z ∼ 0.1.
Current usage metrics show cumulative count of Article Views (full-text article views including HTML views, PDF and ePub downloads, according to the available data) and Abstracts Views on Vision4Press platform.
Data correspond to usage on the plateform after 2015. The current usage metrics is available 48-96 hours after online publication and is updated daily on week days.
Initial download of the metrics may take a while.