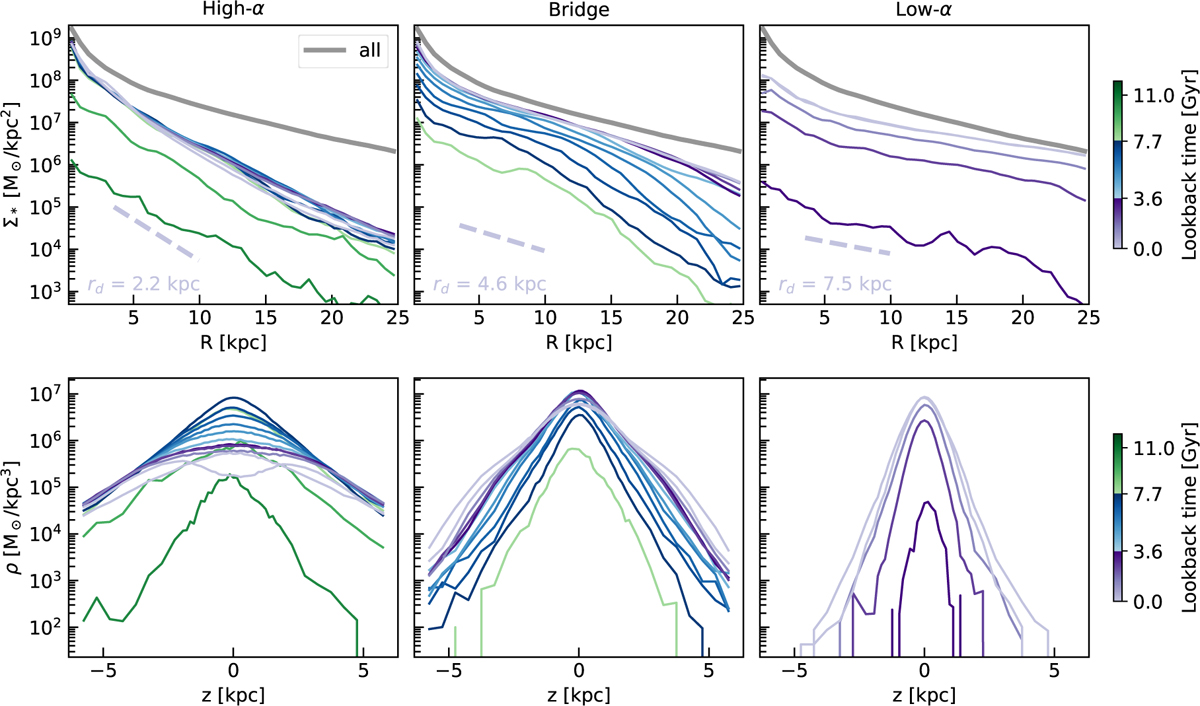
Fig. 5
Download original image
Time evolution of radial stellar surface density (top) and vertical density (bottom) profiles from z = 1.5 to z = 0 for the disc components identified using GMM. The thickest solid grey line represents the total disc surface density profile at z = 0, while the dashed lines show exponential profiles with scale-lengths rd, obtained by fitting the z = 0 surface density profile of each substructure. The vertical profiles are shown in a cylindrical bin within rd ± 1 kpc (see e.g. Park et al. 2021), where rd is calculated at each look-back time.
Current usage metrics show cumulative count of Article Views (full-text article views including HTML views, PDF and ePub downloads, according to the available data) and Abstracts Views on Vision4Press platform.
Data correspond to usage on the plateform after 2015. The current usage metrics is available 48-96 hours after online publication and is updated daily on week days.
Initial download of the metrics may take a while.