Fig. 6
Download original image
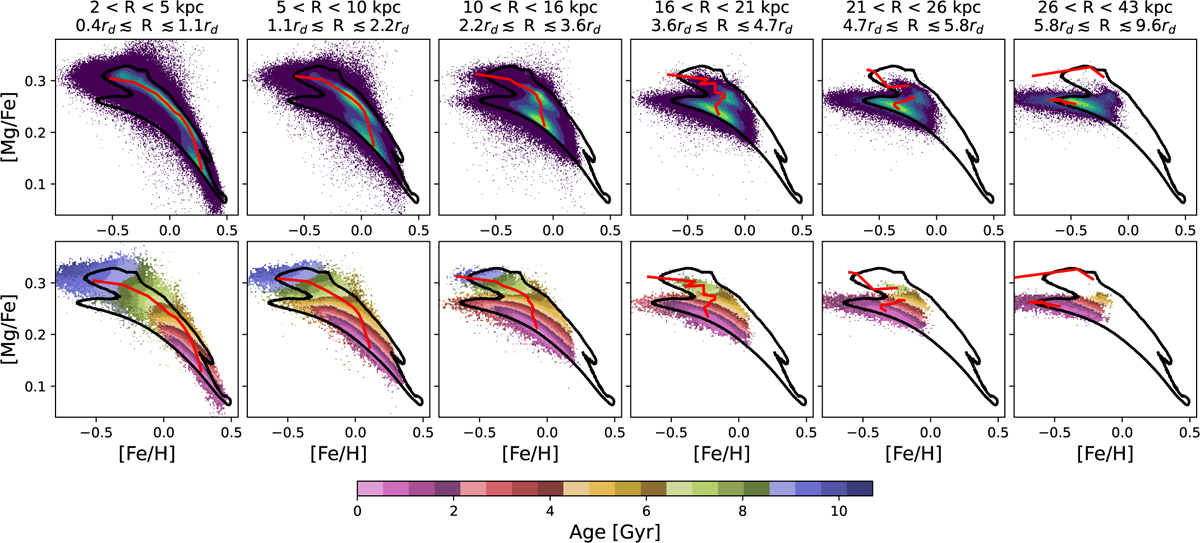
Top: 2D number density of disc star particles within concentric rings with |z| < 1 kpc. The number density distribution is normalised within each ring. Bottom: mean age distribution of disc stars. The red lines depict the chemical evolutionary track of stars formed from in situ gas in each of the rings. In the case of the outer rings, the sequence is discontinuous, as there are periods when no stars form from in situ gas, especially during the spin-up and high-α disc and the bridge-intermediate-α phases. The black contours enclose the region containing 90% of the star particles in the disc.
Current usage metrics show cumulative count of Article Views (full-text article views including HTML views, PDF and ePub downloads, according to the available data) and Abstracts Views on Vision4Press platform.
Data correspond to usage on the plateform after 2015. The current usage metrics is available 48-96 hours after online publication and is updated daily on week days.
Initial download of the metrics may take a while.