Fig. 7
Download original image
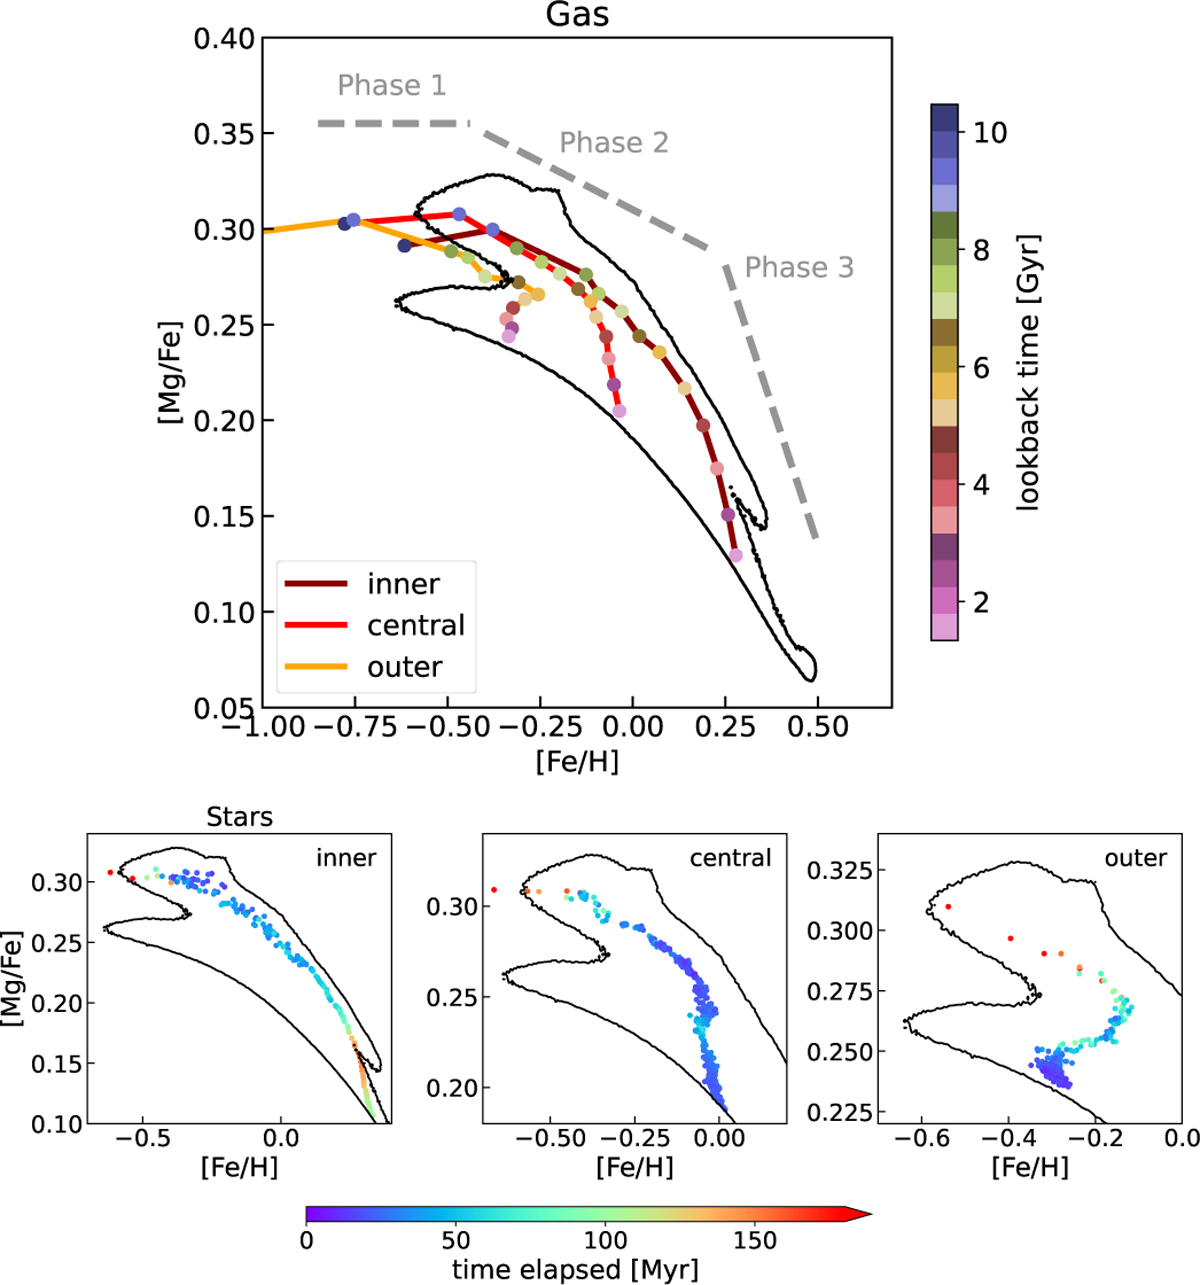
Top panel: gas chemical tracks in the inner, central, and outer disc regions. Each track is constructed by, at each snapshot, selecting the gas within the corresponding region and computing its (mass-weighted) average chemical properties. Grey dashed lines indicate schematically the three general trends exhibited by the chemical tracks. Bottom panels: dynamically evolved stellar chemical tracks for the inner (left), central (middle), and outer (right) regions. These are built by selecting, at the final snapshot, the stars located in each region and tracing back their formation times and birth chemistry. Stars are plotted within the track of the region in which they reside at the end, regardless of their place of birth. Each point represents 103 stars, coloured by the time required to form this number of stars; shorter-bluer (longer-redder) formation times correspond to periods of higher (lower) SFR, thereby tracing the SFH of each region.
Current usage metrics show cumulative count of Article Views (full-text article views including HTML views, PDF and ePub downloads, according to the available data) and Abstracts Views on Vision4Press platform.
Data correspond to usage on the plateform after 2015. The current usage metrics is available 48-96 hours after online publication and is updated daily on week days.
Initial download of the metrics may take a while.