Open Access
Fig. 9
Download original image
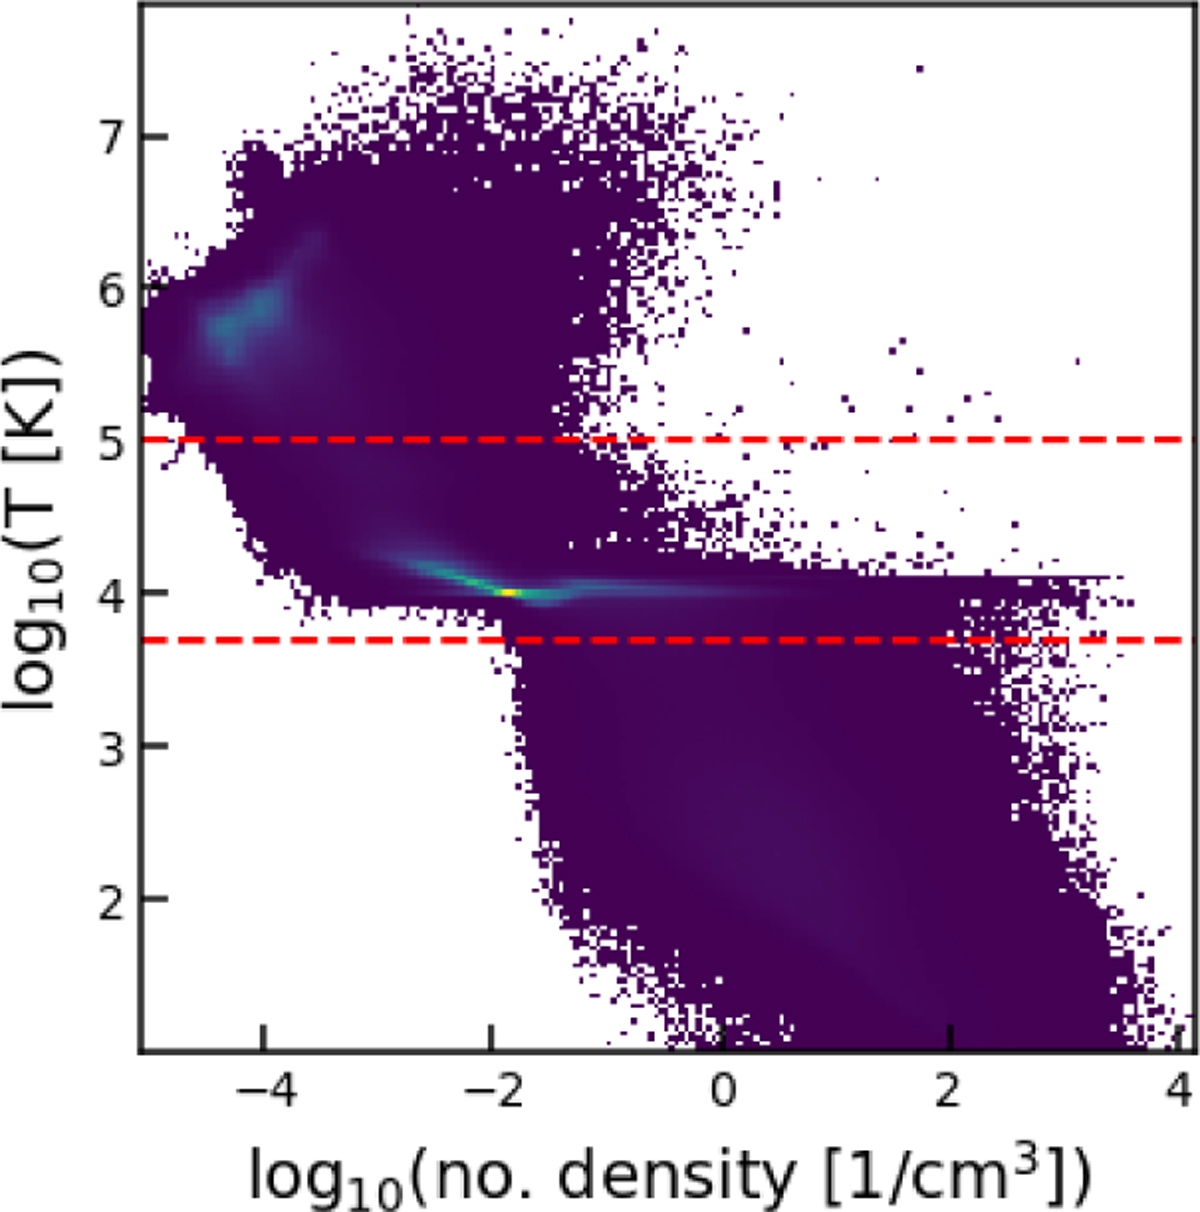
Temperature versus number density distribution of the gas in Romeo at tlb = 5.16 Gyr. The horizontal lines mark the cuts used to define the cold, warm, and hot phases, which separate the gas into the cold disc, the cooling bridge connecting the disc with the corona, and the hot corona.
Current usage metrics show cumulative count of Article Views (full-text article views including HTML views, PDF and ePub downloads, according to the available data) and Abstracts Views on Vision4Press platform.
Data correspond to usage on the plateform after 2015. The current usage metrics is available 48-96 hours after online publication and is updated daily on week days.
Initial download of the metrics may take a while.