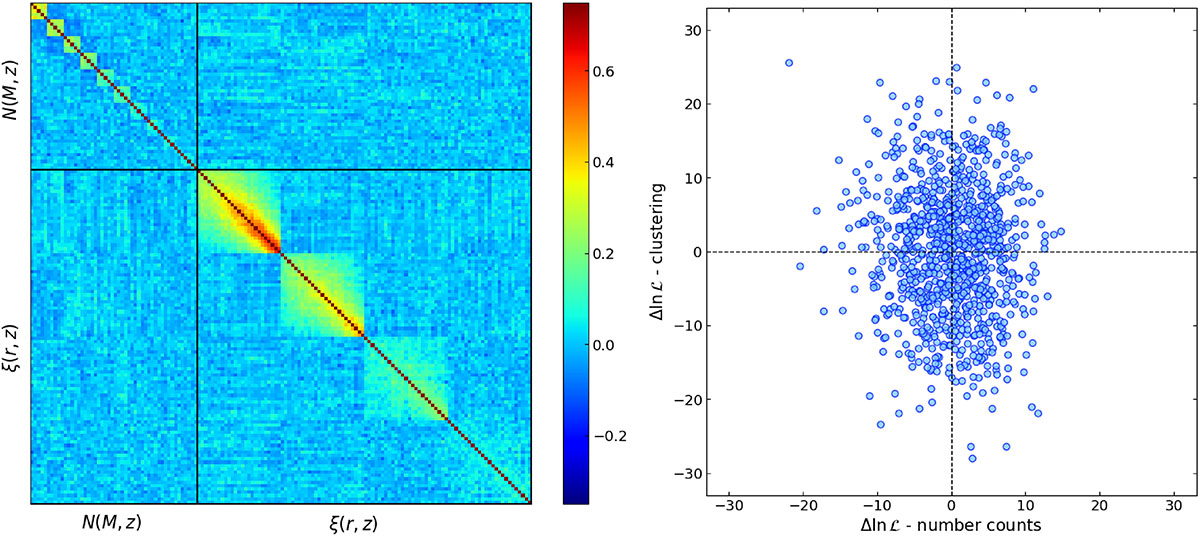
Fig. 1.
Download original image
Cross-covariance between number counts and clustering. For better visualisation, we used redshift bins of width Δz = 0.2 for counts and Δz = 0.5 and a single richness bin for the 2PCF. Left: Auto- and cross-correlation matrix of number counts and clustering, computed from 1000 mocks. Right: Log-likelihood residuals for number counts and clustering for each one of the 1000 light cones, with respect to the mean value assuming the fiducial model parameters.
Current usage metrics show cumulative count of Article Views (full-text article views including HTML views, PDF and ePub downloads, according to the available data) and Abstracts Views on Vision4Press platform.
Data correspond to usage on the plateform after 2015. The current usage metrics is available 48-96 hours after online publication and is updated daily on week days.
Initial download of the metrics may take a while.