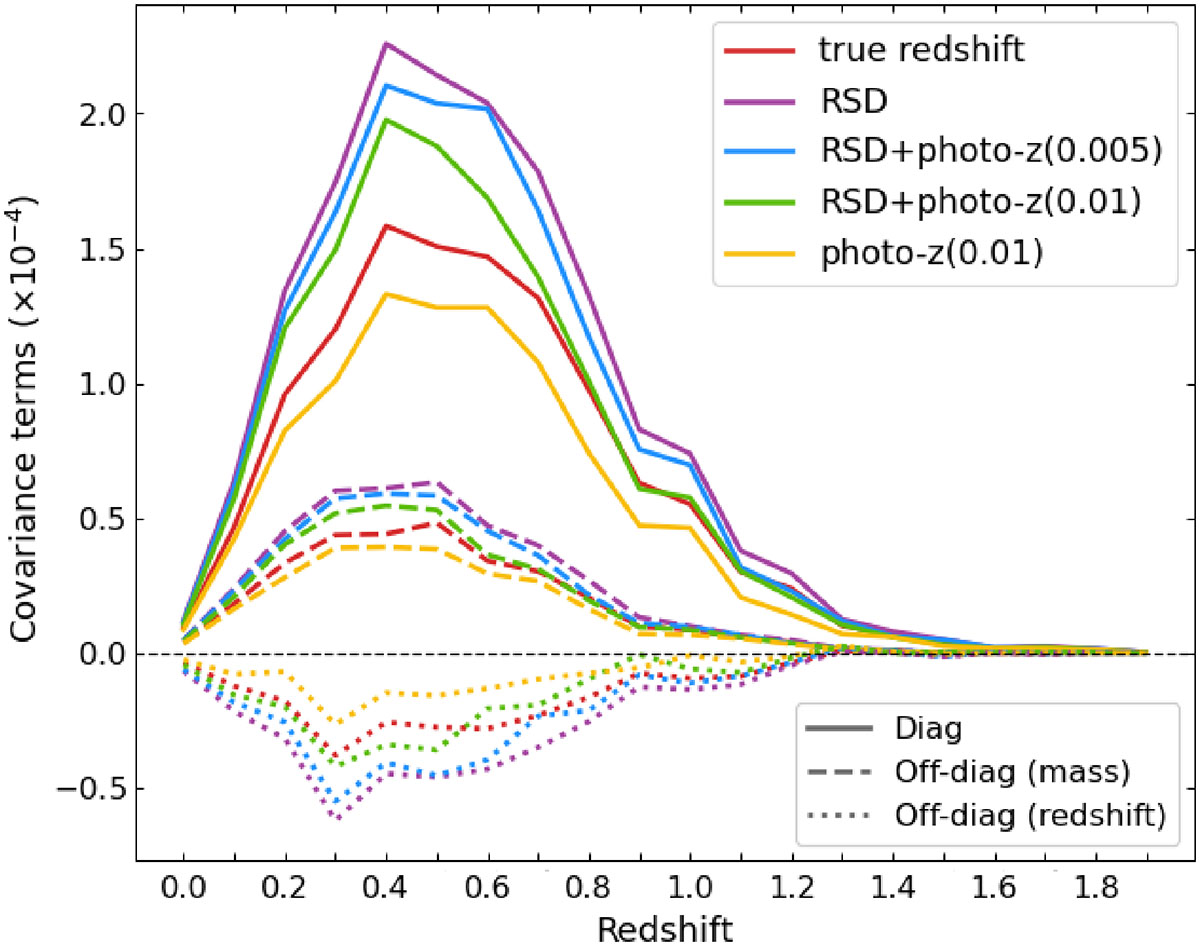
Fig. 8.
Download original image
Number count sample covariance terms from numerical simulations for different redshift settings: undistorted (red lines), RSDs (purple lines), RSDs and small photo-z uncertainty (σz0 = 0.005, blue lines), RSDs and large photo-z uncertainty (σz0 = 0.01, green lines), and redshift with only large photo-z uncertainty (σz0 = 0.01, yellow lines). Solid lines represent the diagonal sample variance, dashed lines are the sample covariance between two adjacent mass bins (first and second) and same redshift bin, and dotted lines are the sample covariance between adjacent redshift bins and same mass bin (first one).
Current usage metrics show cumulative count of Article Views (full-text article views including HTML views, PDF and ePub downloads, according to the available data) and Abstracts Views on Vision4Press platform.
Data correspond to usage on the plateform after 2015. The current usage metrics is available 48-96 hours after online publication and is updated daily on week days.
Initial download of the metrics may take a while.