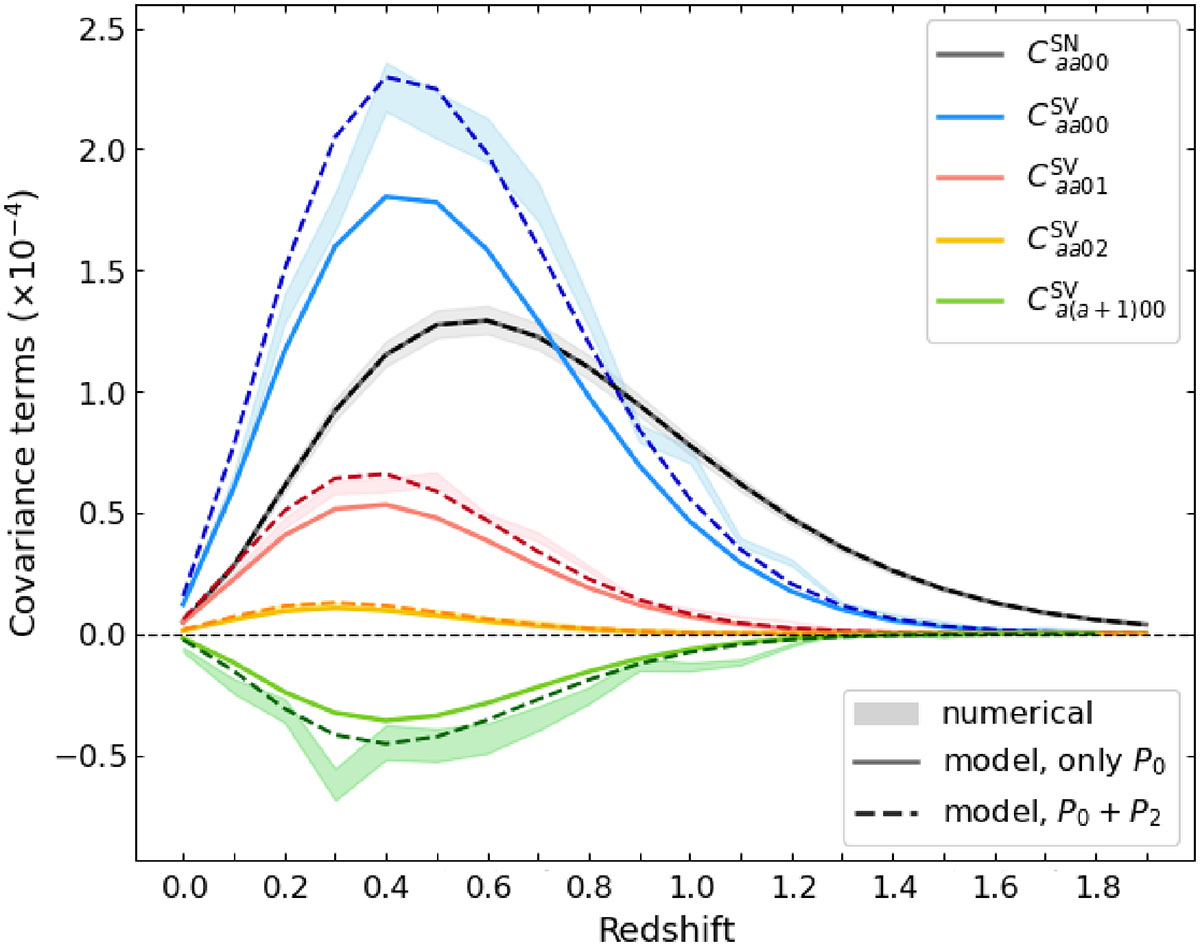
Fig. 9.
Download original image
Number count covariance terms: numerical matrix (shaded areas, representing the 1σ region), analytical model with power spectrum monopole (solid lines), and model with effective power spectrum (see Eq. (31), dashed lines). The colour-coded terms represent different components: Grey is for diagonal shot-noise; blue is for diagonal sample variance; red and yellow are for the first and second off-diagonal sample covariance between mass bins, respectively; and green is for the first off-diagonal sample covariance in redshift bins.
Current usage metrics show cumulative count of Article Views (full-text article views including HTML views, PDF and ePub downloads, according to the available data) and Abstracts Views on Vision4Press platform.
Data correspond to usage on the plateform after 2015. The current usage metrics is available 48-96 hours after online publication and is updated daily on week days.
Initial download of the metrics may take a while.