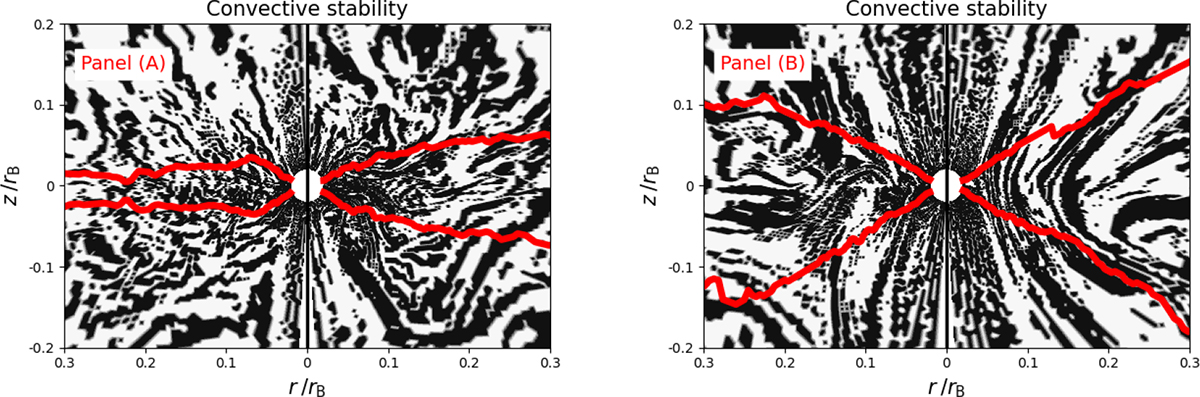
Fig. 10.
Download original image
Convective stability analysis. The result is obtained according to Equation (16) based on simulation data at 4.5tB. The red solid lines mark the density scale height of accretion flows, as shown in Figure 2. Panel (A): Runs R22 (left) and R23 (right). Panel (B): Runs R24 (left) and N24 (right). The black regions are unstable.
Current usage metrics show cumulative count of Article Views (full-text article views including HTML views, PDF and ePub downloads, according to the available data) and Abstracts Views on Vision4Press platform.
Data correspond to usage on the plateform after 2015. The current usage metrics is available 48-96 hours after online publication and is updated daily on week days.
Initial download of the metrics may take a while.