Fig. 5.
Download original image
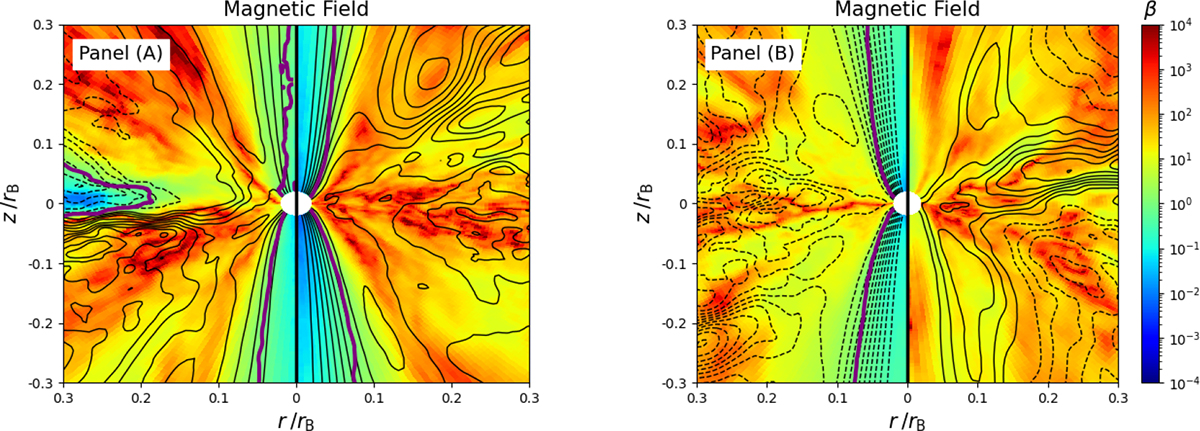
Distribution of the plasma β and poloidal magnetic fields. Colors represent the ratio (β) of the time-averaged gas pressure to the magnetic pressure of the time-averaged magnetic field. The solid and dashed lines reflect the magnetic fields on the poloidal plane. The purple line indicates the interface at which β = 1. Panel (A): Runs R22 (left) and R23 (right). Panel (B): Runs R24 (left) and N24 (right).
Current usage metrics show cumulative count of Article Views (full-text article views including HTML views, PDF and ePub downloads, according to the available data) and Abstracts Views on Vision4Press platform.
Data correspond to usage on the plateform after 2015. The current usage metrics is available 48-96 hours after online publication and is updated daily on week days.
Initial download of the metrics may take a while.