Fig. 1
Download original image
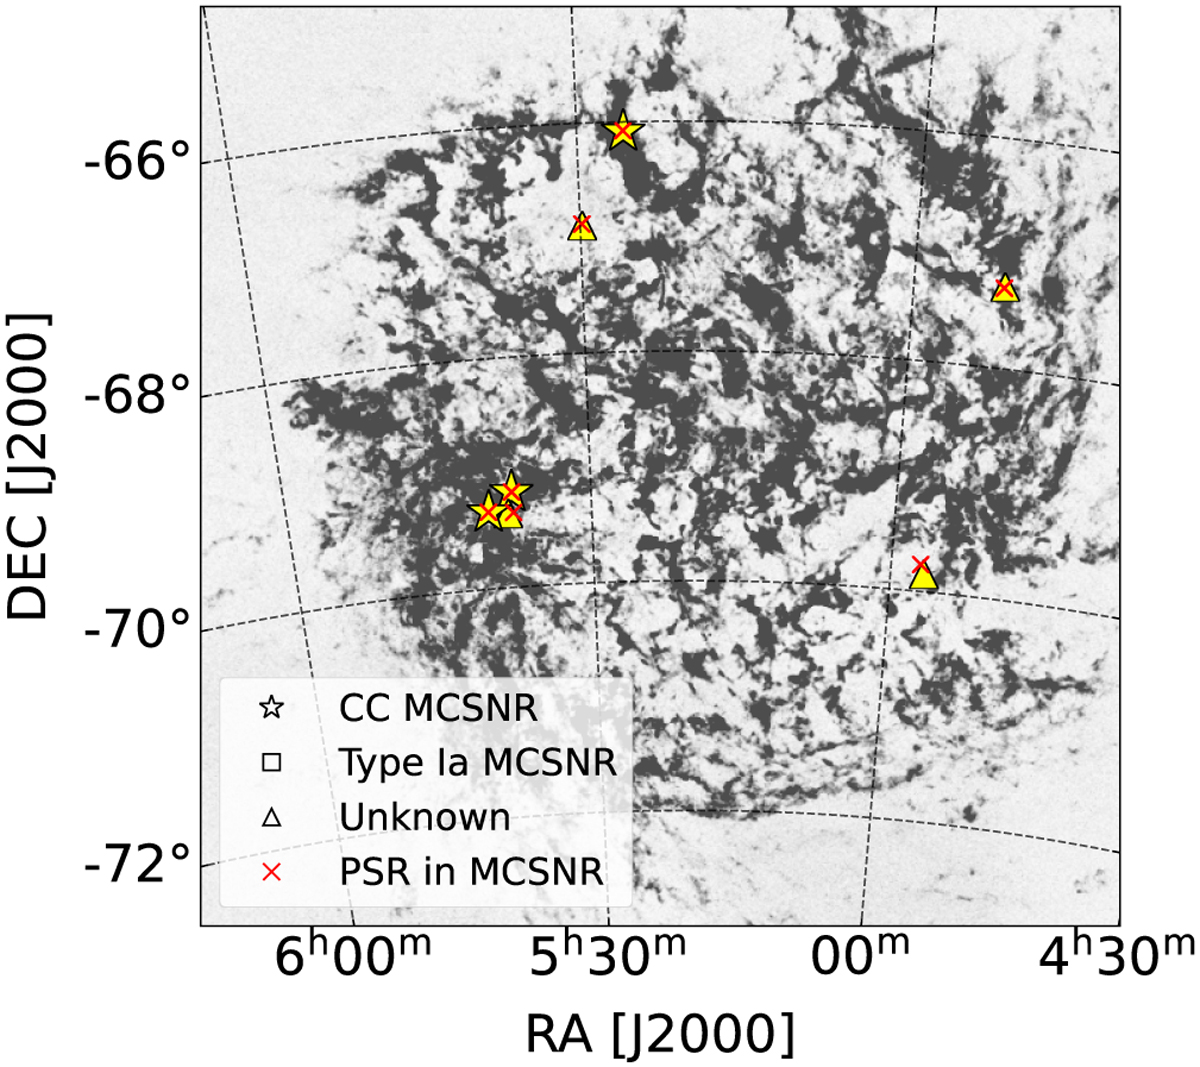
Spatial distribution of the SNRs with matched pulsars over-layed onto the H I surface brightness map of Kim et al. (1998). The yellow markers show the positions of the SNRs with a match, distinguishing between core-collapse (stars), type Ia (squares), and unknown SNR explosion types (triangles). The red crosses show the position of the matched pulsars.
Current usage metrics show cumulative count of Article Views (full-text article views including HTML views, PDF and ePub downloads, according to the available data) and Abstracts Views on Vision4Press platform.
Data correspond to usage on the plateform after 2015. The current usage metrics is available 48-96 hours after online publication and is updated daily on week days.
Initial download of the metrics may take a while.