Open Access
Fig. 2
Download original image
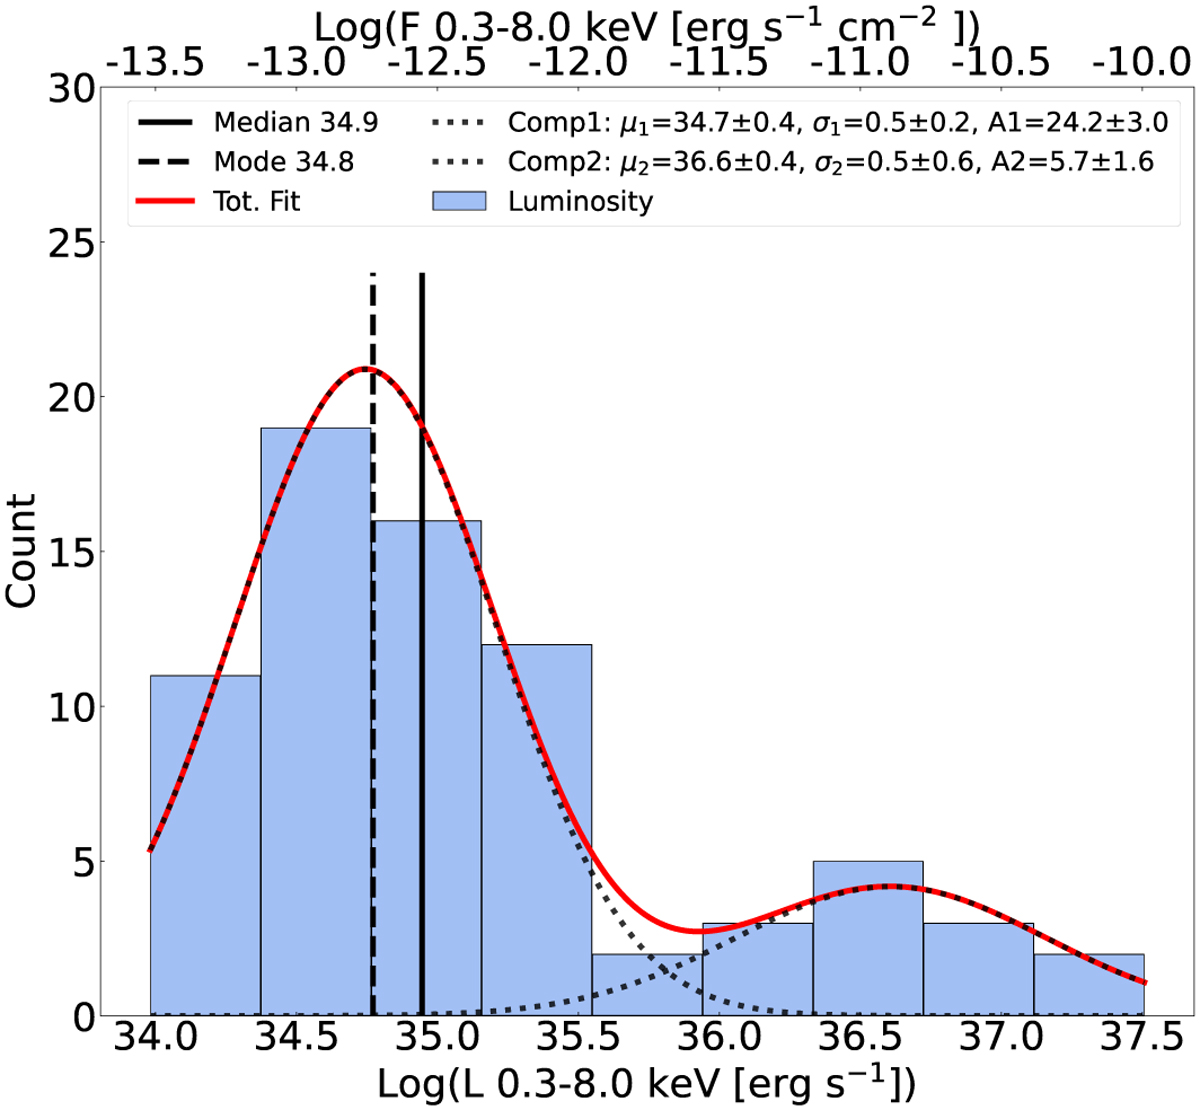
Histogram of the luminosity and flux in the energy band of 0.38.0 keV for the SNRs and SNR candidates in the LMC. The solid red line shows the best fit of the distribution with the dashed lines indicating the two Gaussian components of the best fit.
Current usage metrics show cumulative count of Article Views (full-text article views including HTML views, PDF and ePub downloads, according to the available data) and Abstracts Views on Vision4Press platform.
Data correspond to usage on the plateform after 2015. The current usage metrics is available 48-96 hours after online publication and is updated daily on week days.
Initial download of the metrics may take a while.