Fig. C.3
Download original image
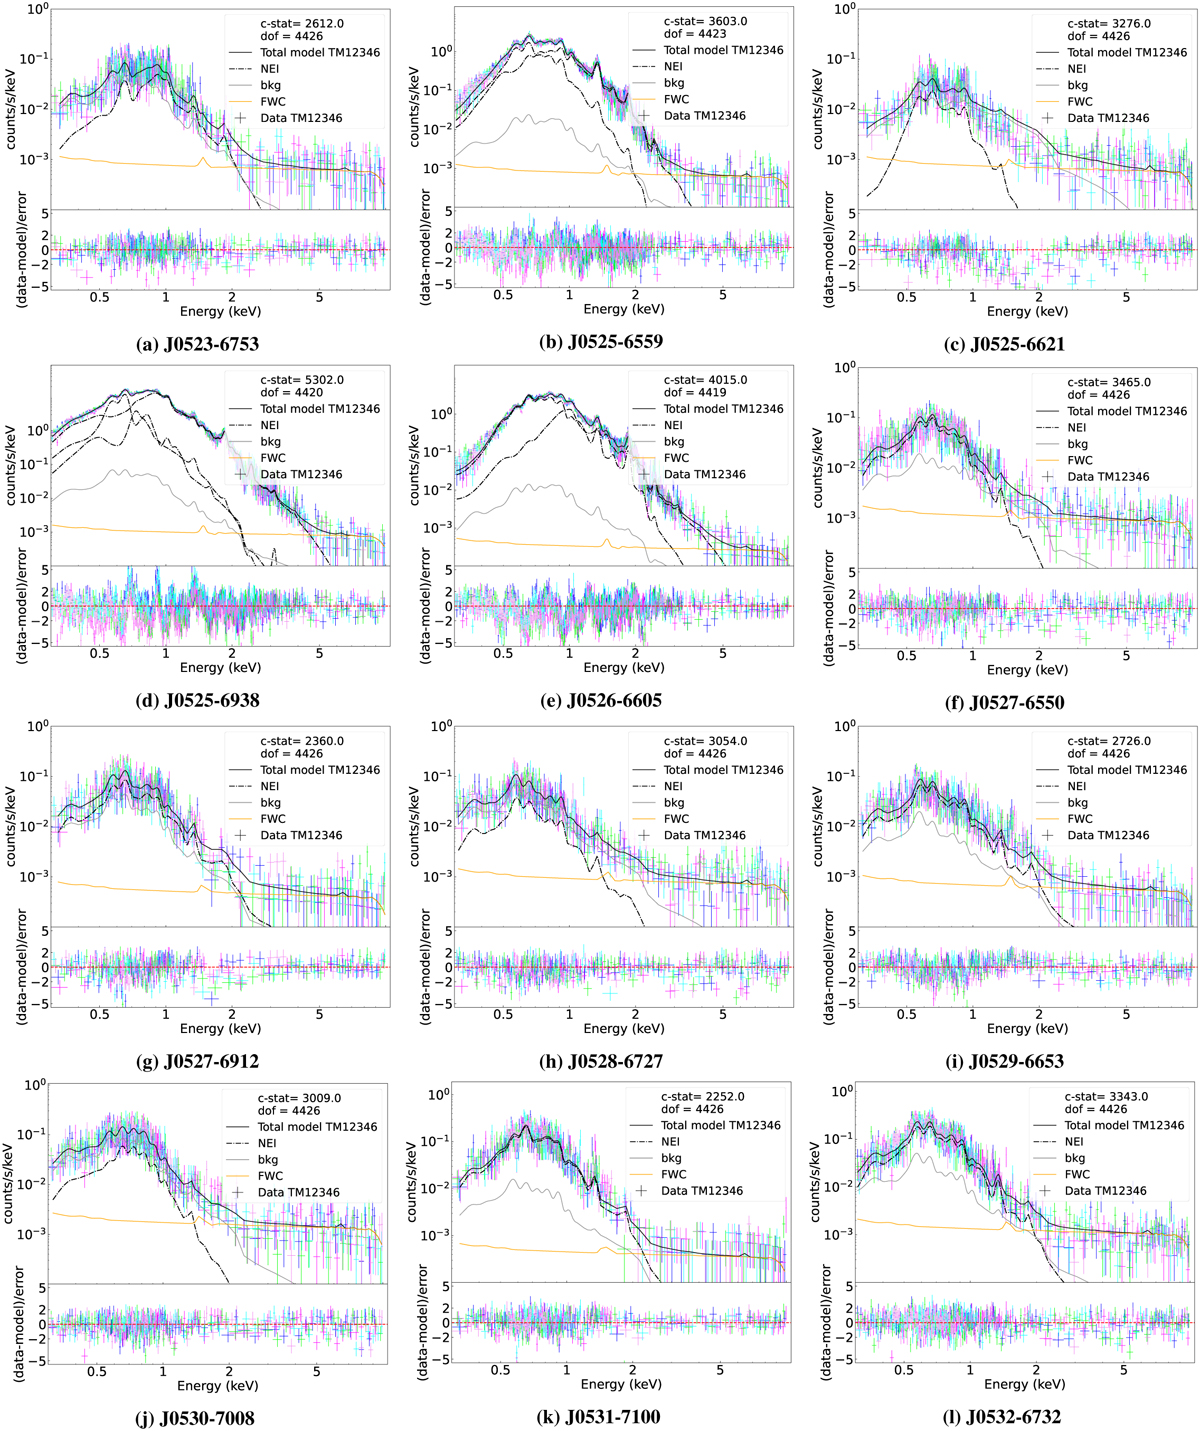
eROSITA spectra with best-fit spectra. The coloured cross show the spectra of TM 1,2,3,4 and 6. The solid black lines show the total model (source + background), while the dot-dashed lines show the contribution of the SNR as one or multiple NEI components. The grey solid lines show the compound background model, while the orange solid lines show the contribution of the instrumental and particle background.
Current usage metrics show cumulative count of Article Views (full-text article views including HTML views, PDF and ePub downloads, according to the available data) and Abstracts Views on Vision4Press platform.
Data correspond to usage on the plateform after 2015. The current usage metrics is available 48-96 hours after online publication and is updated daily on week days.
Initial download of the metrics may take a while.