Fig. 1
Download original image
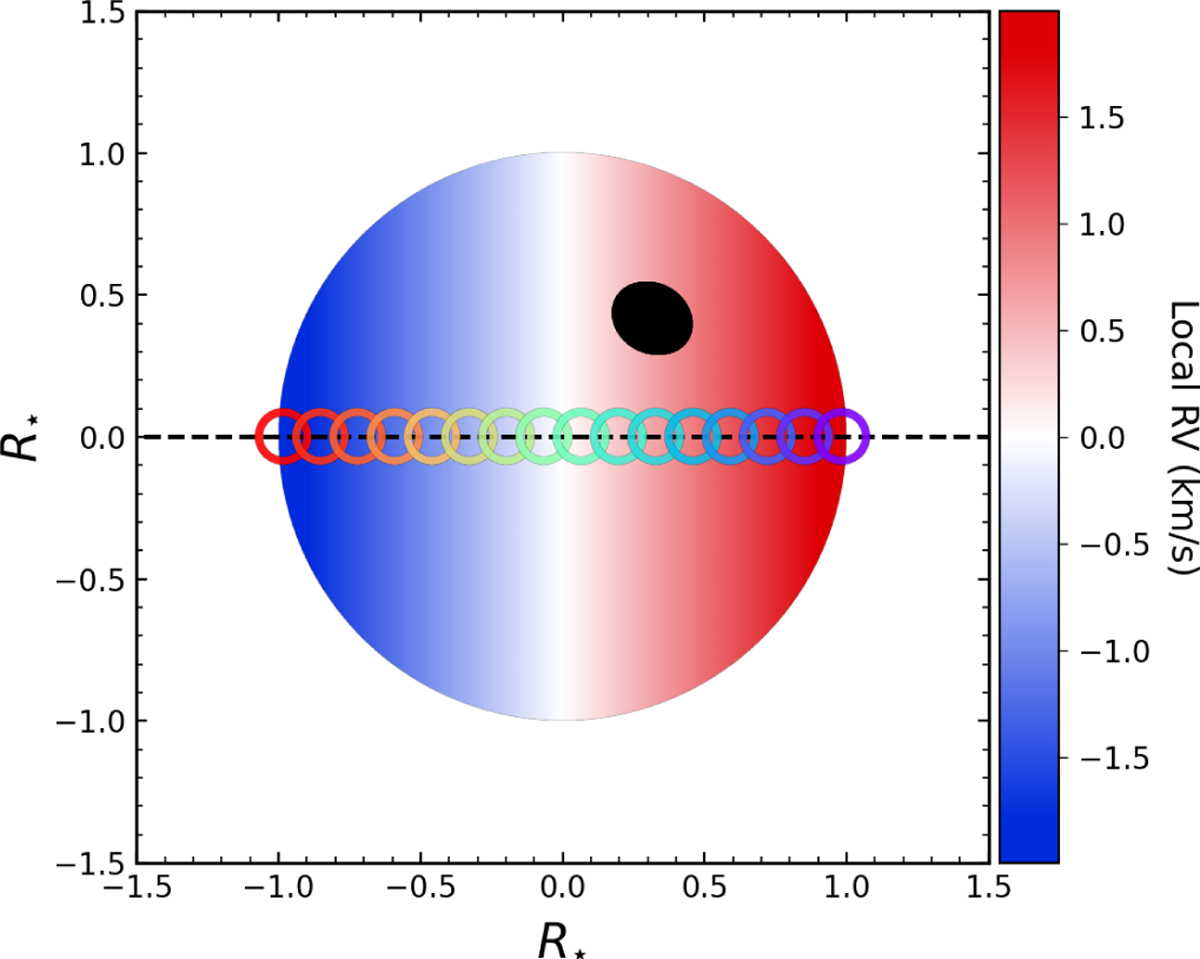
Doppler map of the visible hemisphere of the Sun-like star. Colored open circles indicate the planet positions during transit, moving from red to purple as the transit progresses. For clarity, the data points are undersampled in the figure; the full dataset was used in the analysis. The dotted black line shows the transit path, while the black disk represents a simulated spot with a filling factor of 1% smeared over time.
Current usage metrics show cumulative count of Article Views (full-text article views including HTML views, PDF and ePub downloads, according to the available data) and Abstracts Views on Vision4Press platform.
Data correspond to usage on the plateform after 2015. The current usage metrics is available 48-96 hours after online publication and is updated daily on week days.
Initial download of the metrics may take a while.