Fig. C.1
Download original image
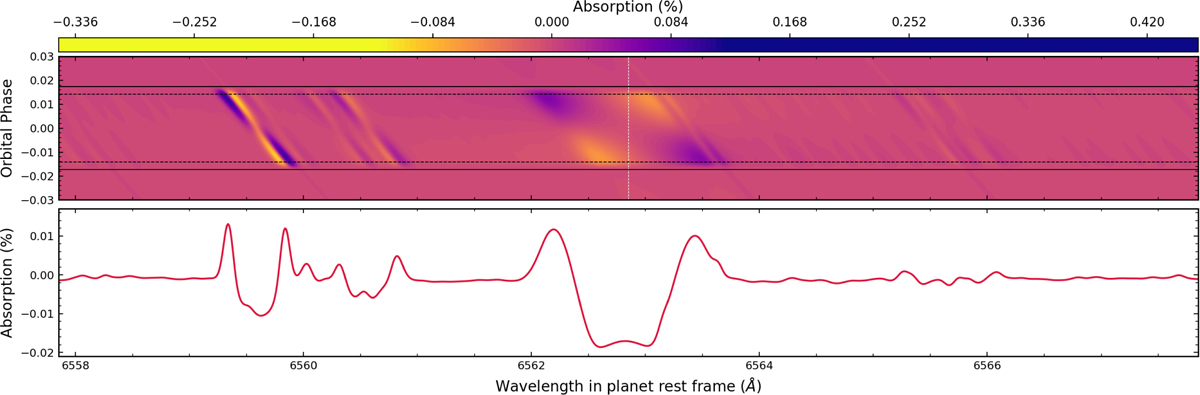
Top panel: Tomography plot of the individual absorption spectra near the Hα line for a simulated hot Jupiter, including the effect of a stellar spot. Bottom panel: Mean in-transit planetary absorption spectra around the Hα line. The horizontal black lines represent the four transit contacts, while the dashed white line traces the center of the line. Both plots are shown in the planet’s rest frame. For this case, the spots parameters are: fsp = 1%, θlat = 25°, θlon = 20°.
Current usage metrics show cumulative count of Article Views (full-text article views including HTML views, PDF and ePub downloads, according to the available data) and Abstracts Views on Vision4Press platform.
Data correspond to usage on the plateform after 2015. The current usage metrics is available 48-96 hours after online publication and is updated daily on week days.
Initial download of the metrics may take a while.