Fig. 3
Download original image
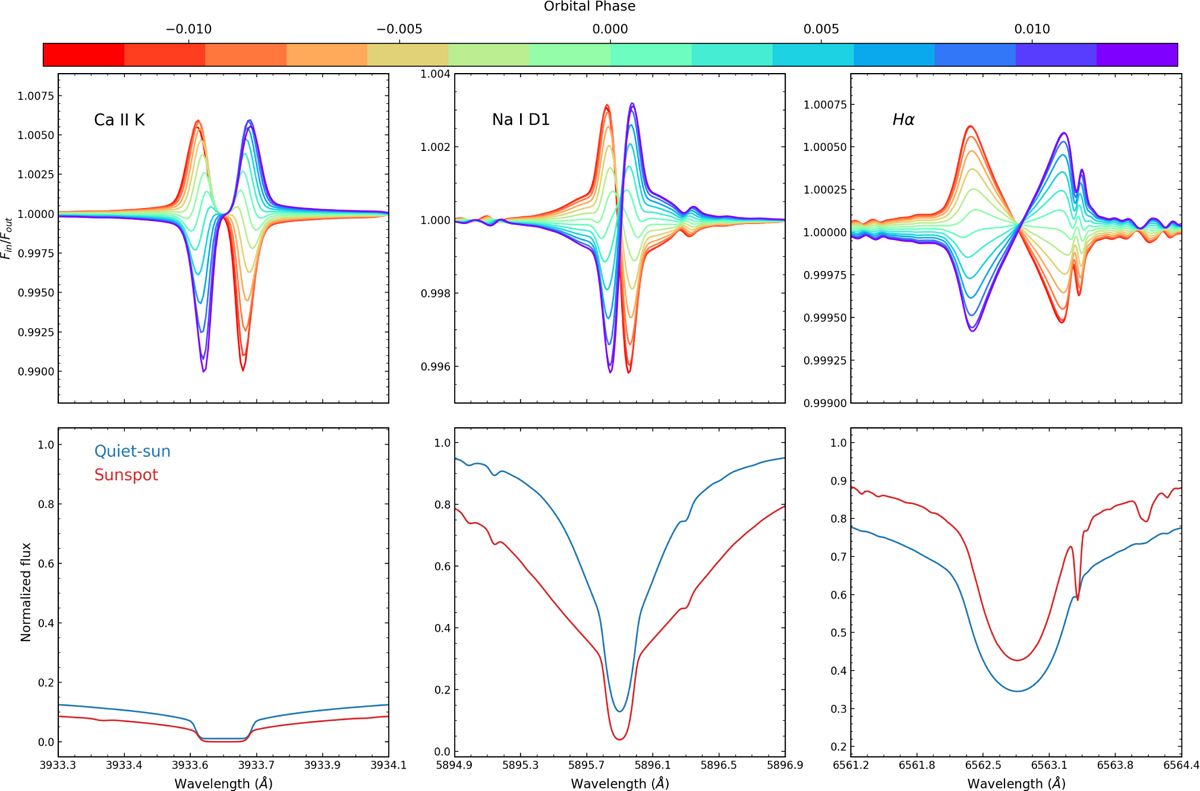
Top panel: transmission spectrum in the stellar rest frame for a planet-spot configuration with planet orbital phase (position) indicated by the colored circles. The color coding is identical to that used in Figure 1. Bottom panel: zoom of the normalized spot and quiet Suns spectra shown in Figure 2 for the three spectral regions studied.
Current usage metrics show cumulative count of Article Views (full-text article views including HTML views, PDF and ePub downloads, according to the available data) and Abstracts Views on Vision4Press platform.
Data correspond to usage on the plateform after 2015. The current usage metrics is available 48-96 hours after online publication and is updated daily on week days.
Initial download of the metrics may take a while.