Fig. 4
Download original image
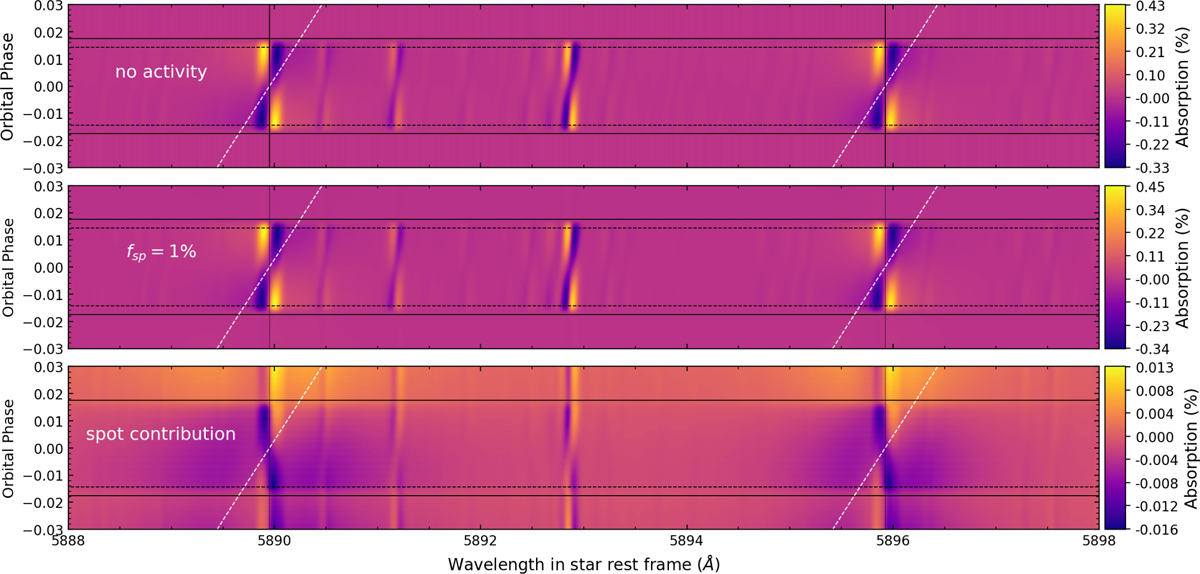
Tomography plots of the individual absorption spectra around the Na I doublet for a simulated hot Jupiter. The top panel shows the case without stellar activity, the middle panel includes the effect of a stellar spot with a coverage fraction of fsp = 1%, and the bottom panel displays the isolated spot contribution, obtained as the difference between the two upper panels. The color scale represents the absorption (1 − Fin/Fout) in percent, while the dashed white line traces the expected planetary trail. The horizontal black lines indicate the four contact points of the transit. For this case we adopt v sin i = 2 km s−1.
Current usage metrics show cumulative count of Article Views (full-text article views including HTML views, PDF and ePub downloads, according to the available data) and Abstracts Views on Vision4Press platform.
Data correspond to usage on the plateform after 2015. The current usage metrics is available 48-96 hours after online publication and is updated daily on week days.
Initial download of the metrics may take a while.