Fig. 5
Download original image
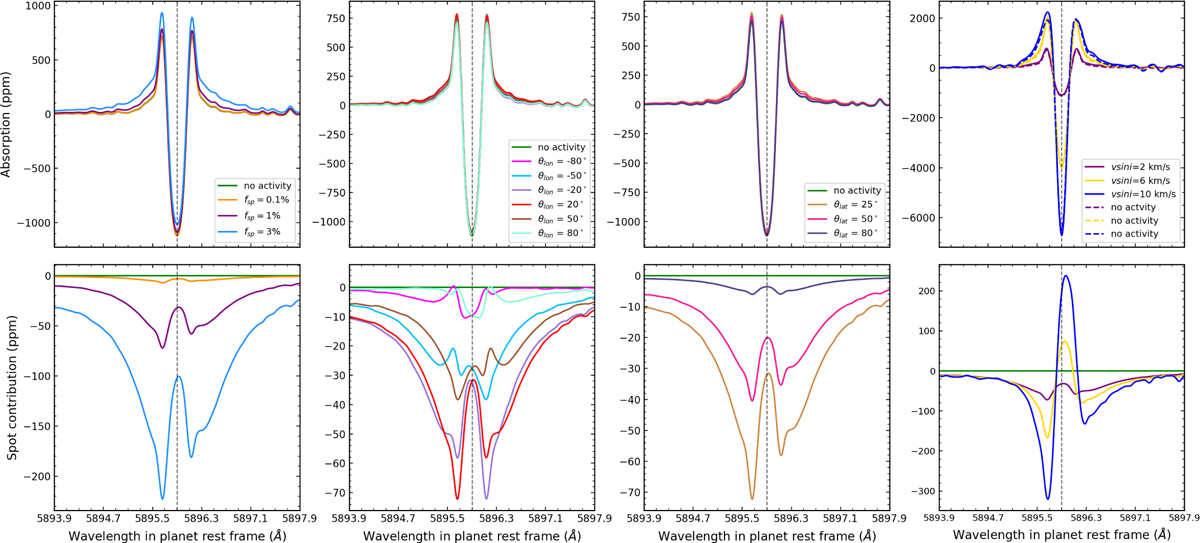
Top: mean in-transit absorption spectra in the planetary rest frame around the Na I D1 line. Bottom: spot contribution as the difference obtained by subtracting the quiet-star profiles from the star with a spot profiles. Each column represents (from left to right) the impact of spot size, spot position (longitude and latitude, respectively), and stellar rotational velocity. In each case the fixed parameters were fsp = 1%, θlat = 25°, θlon = 20°, and v sin i = 2 km s−1.
Current usage metrics show cumulative count of Article Views (full-text article views including HTML views, PDF and ePub downloads, according to the available data) and Abstracts Views on Vision4Press platform.
Data correspond to usage on the plateform after 2015. The current usage metrics is available 48-96 hours after online publication and is updated daily on week days.
Initial download of the metrics may take a while.