Fig. 1.
Download original image
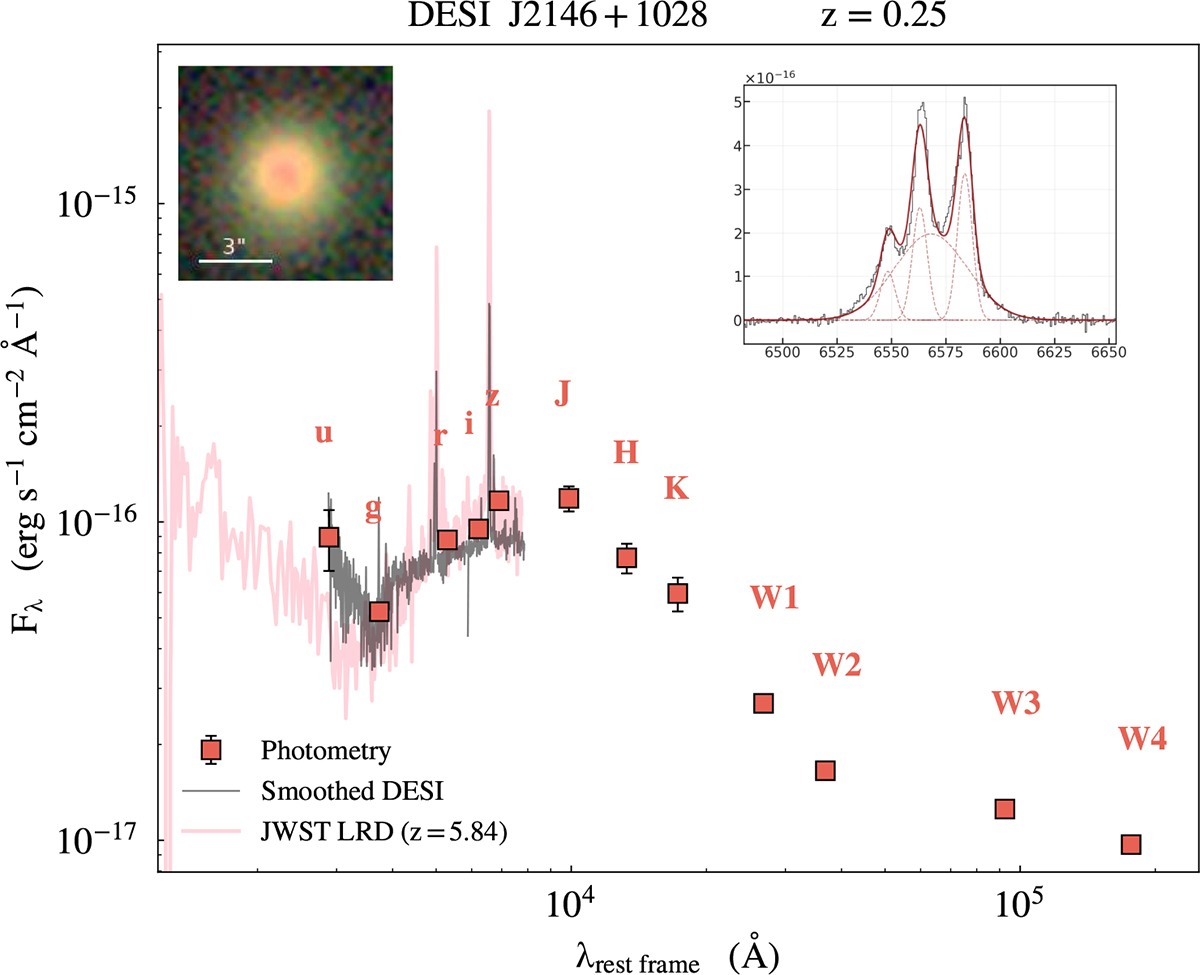
Multi-wavelength view of a LRD analogue at z = 0.25. Main panel: Rest-frame SED showing archival photometry (red squares) and the smoothed DESI spectrum (black line). For comparison, the rest-frame JWST/NIRSpec PRISM spectrum of a high-redshift LRD is overplotted in pink. Top left inset: DESI Legacy Imaging Surveys grz-composite image (Dey et al. 2019) showing the compact morphology. Top right inset: Zoomed-in rest-frame DESI spectrum and fitting models of the Hα region.
Current usage metrics show cumulative count of Article Views (full-text article views including HTML views, PDF and ePub downloads, according to the available data) and Abstracts Views on Vision4Press platform.
Data correspond to usage on the plateform after 2015. The current usage metrics is available 48-96 hours after online publication and is updated daily on week days.
Initial download of the metrics may take a while.