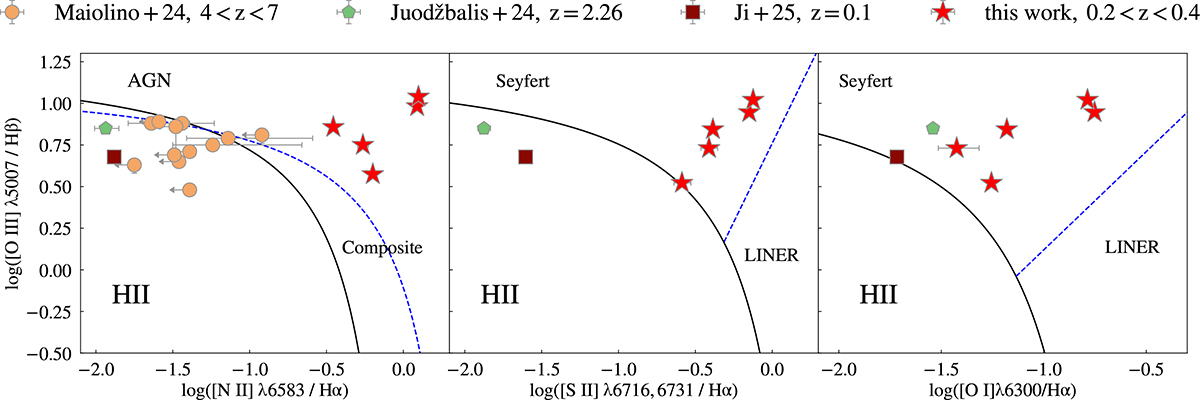
Fig. 2.
Download original image
Locations of five LRD analogues in BPT/VO diagrams (Baldwin et al. 1981; Veilleux & Osterbrock 1987) with black solid and blue dashed demarcation lines (Kewley et al. 2001, 2006; Kauffmann et al. 2003). Our sample objects are shown as red stars. For comparison, we show high-redshift LRDs from Matthee et al. (2024) as orange circles. We also show the Rosetta Stone at z = 2.26 (green pentagon; Juodžbalis et al. 2024) and a previously identified local LRD at z = 0.1 (brown square; Ji et al. 2026).
Current usage metrics show cumulative count of Article Views (full-text article views including HTML views, PDF and ePub downloads, according to the available data) and Abstracts Views on Vision4Press platform.
Data correspond to usage on the plateform after 2015. The current usage metrics is available 48-96 hours after online publication and is updated daily on week days.
Initial download of the metrics may take a while.