Open Access
Fig. 3.
Download original image
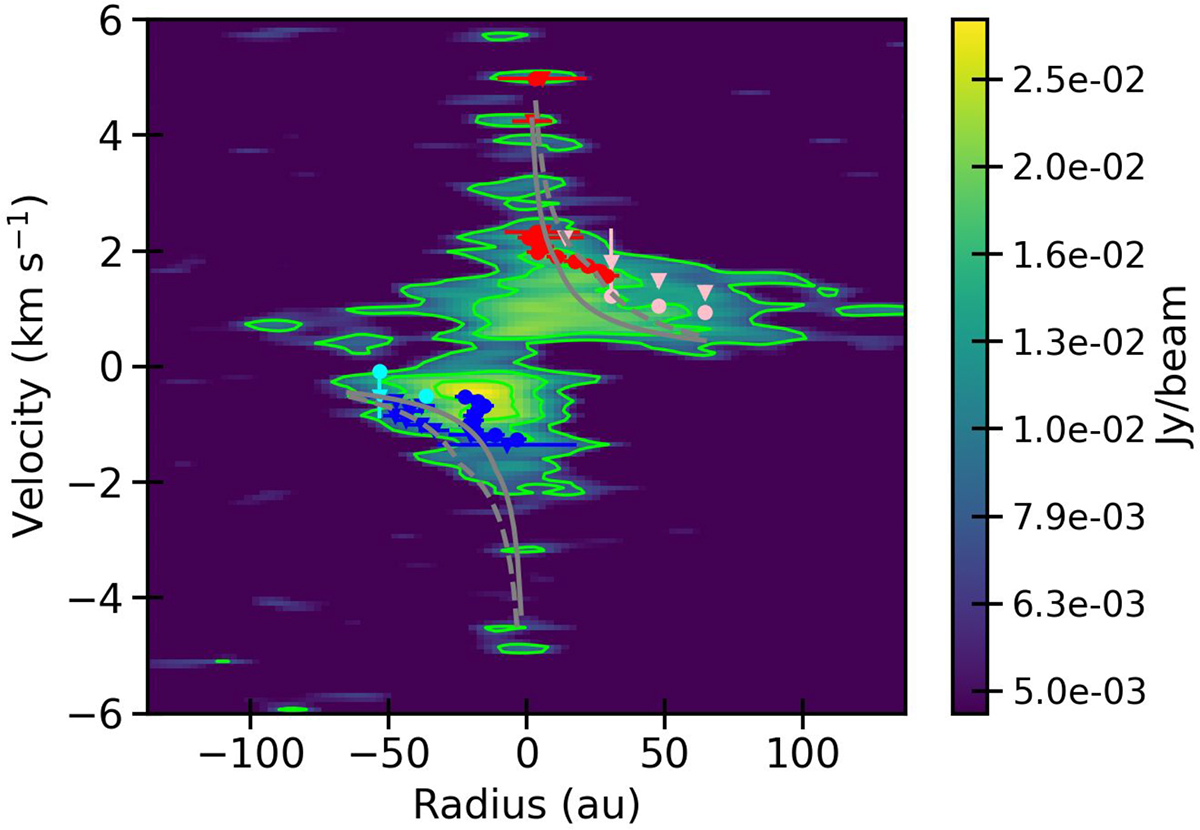
Position-velocity diagram built along the major axis of the C18O emission. The contours represent values of 3, 6, and 9σ. We include the extracted velocities from the edge (pink and cyan) and ridge (blue and red) methods within SLAM, assuming a Keplerian rotation pattern.
Current usage metrics show cumulative count of Article Views (full-text article views including HTML views, PDF and ePub downloads, according to the available data) and Abstracts Views on Vision4Press platform.
Data correspond to usage on the plateform after 2015. The current usage metrics is available 48-96 hours after online publication and is updated daily on week days.
Initial download of the metrics may take a while.