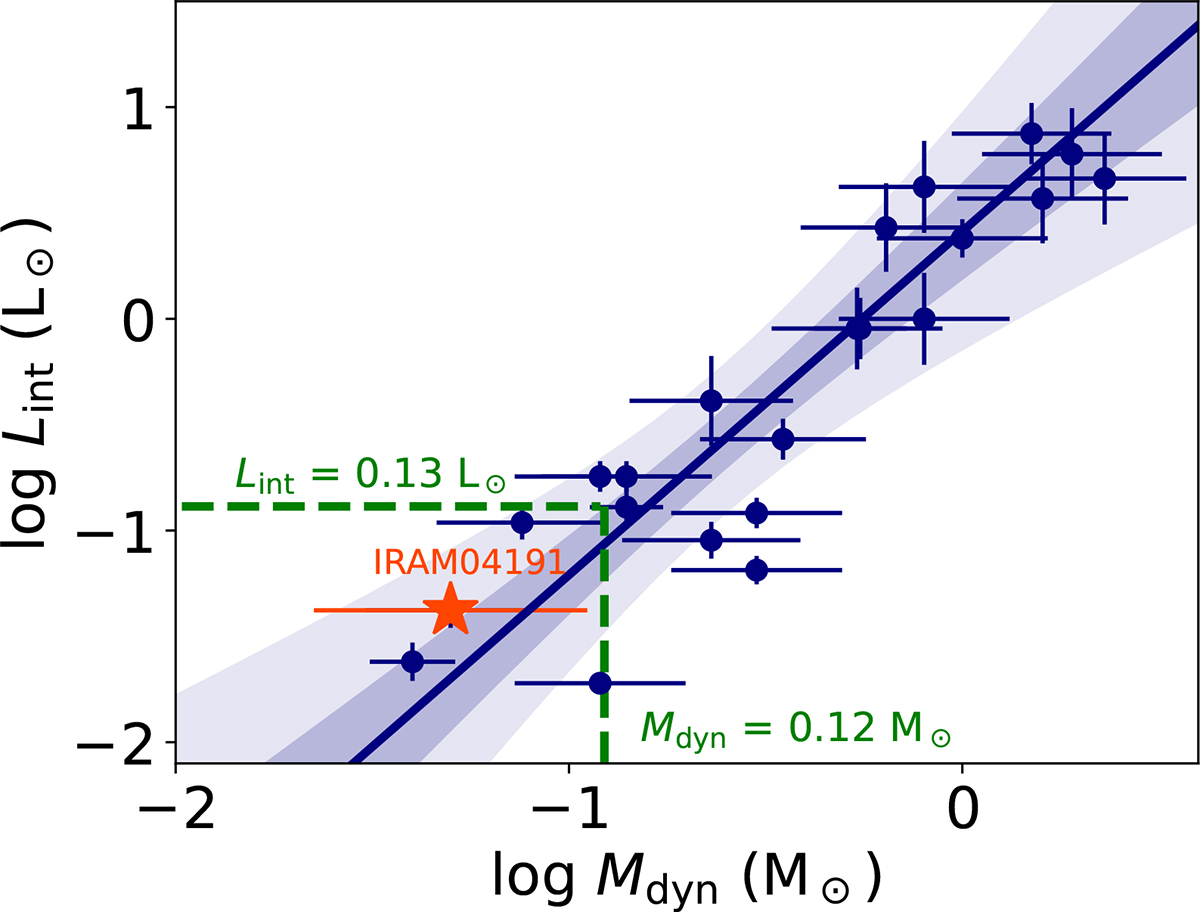
Fig. 4.
Download original image
Dynamical mass (Mdyn) vs. Lint diagram adopted from Palau et al. (2024). Blue symbols represent protostars, VeLLOs, and proto-BD candidates with Lint and Mdyn measurements, while the solid line represents the fit to the data. The shaded area corresponds to two (dark) and five times (light) the uncertainty of the fit. The dashed green lines at the bottom left delimit the region consistent with proto-BDs. We represent IRAM 04191 with Mdyn derived in this work, and Lint from Pérez-García et al. (2025).
Current usage metrics show cumulative count of Article Views (full-text article views including HTML views, PDF and ePub downloads, according to the available data) and Abstracts Views on Vision4Press platform.
Data correspond to usage on the plateform after 2015. The current usage metrics is available 48-96 hours after online publication and is updated daily on week days.
Initial download of the metrics may take a while.