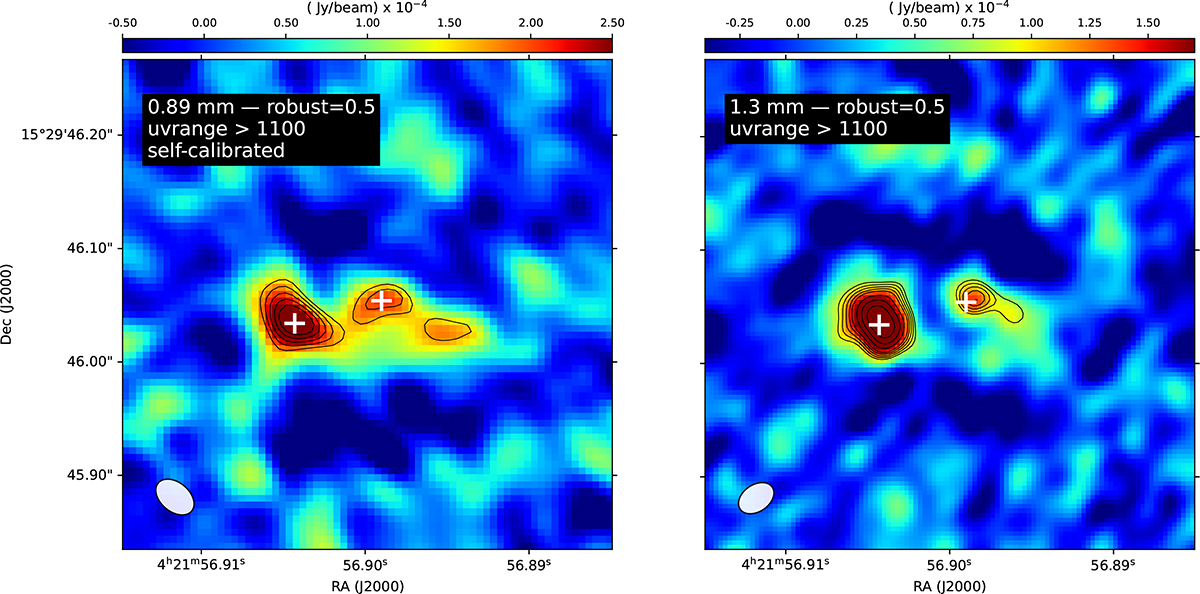
Fig. B.2.
Download original image
Observations of IRAM04191 with uv range > 1100 kλ. The images are smoothed with a Gaussian whose full width at half maximum is approximately equal to the synthesized beam. The contours in the two images represent 3, 3.5, 4, 4.5, 5, 6, 7, 8 times the rms. Left panel: ALMA 0.89 mm data (rms 5.4e-5 Jy/beam). Right panel: ALMA 1.3 mm data (rms = 2.8e-5 Jy/beam). The white crosses represent the position of the two sources detected in the ALMA 1.3 mm data with full uv range displayed in Fig. 1.
Current usage metrics show cumulative count of Article Views (full-text article views including HTML views, PDF and ePub downloads, according to the available data) and Abstracts Views on Vision4Press platform.
Data correspond to usage on the plateform after 2015. The current usage metrics is available 48-96 hours after online publication and is updated daily on week days.
Initial download of the metrics may take a while.