Fig. A.4
Download original image
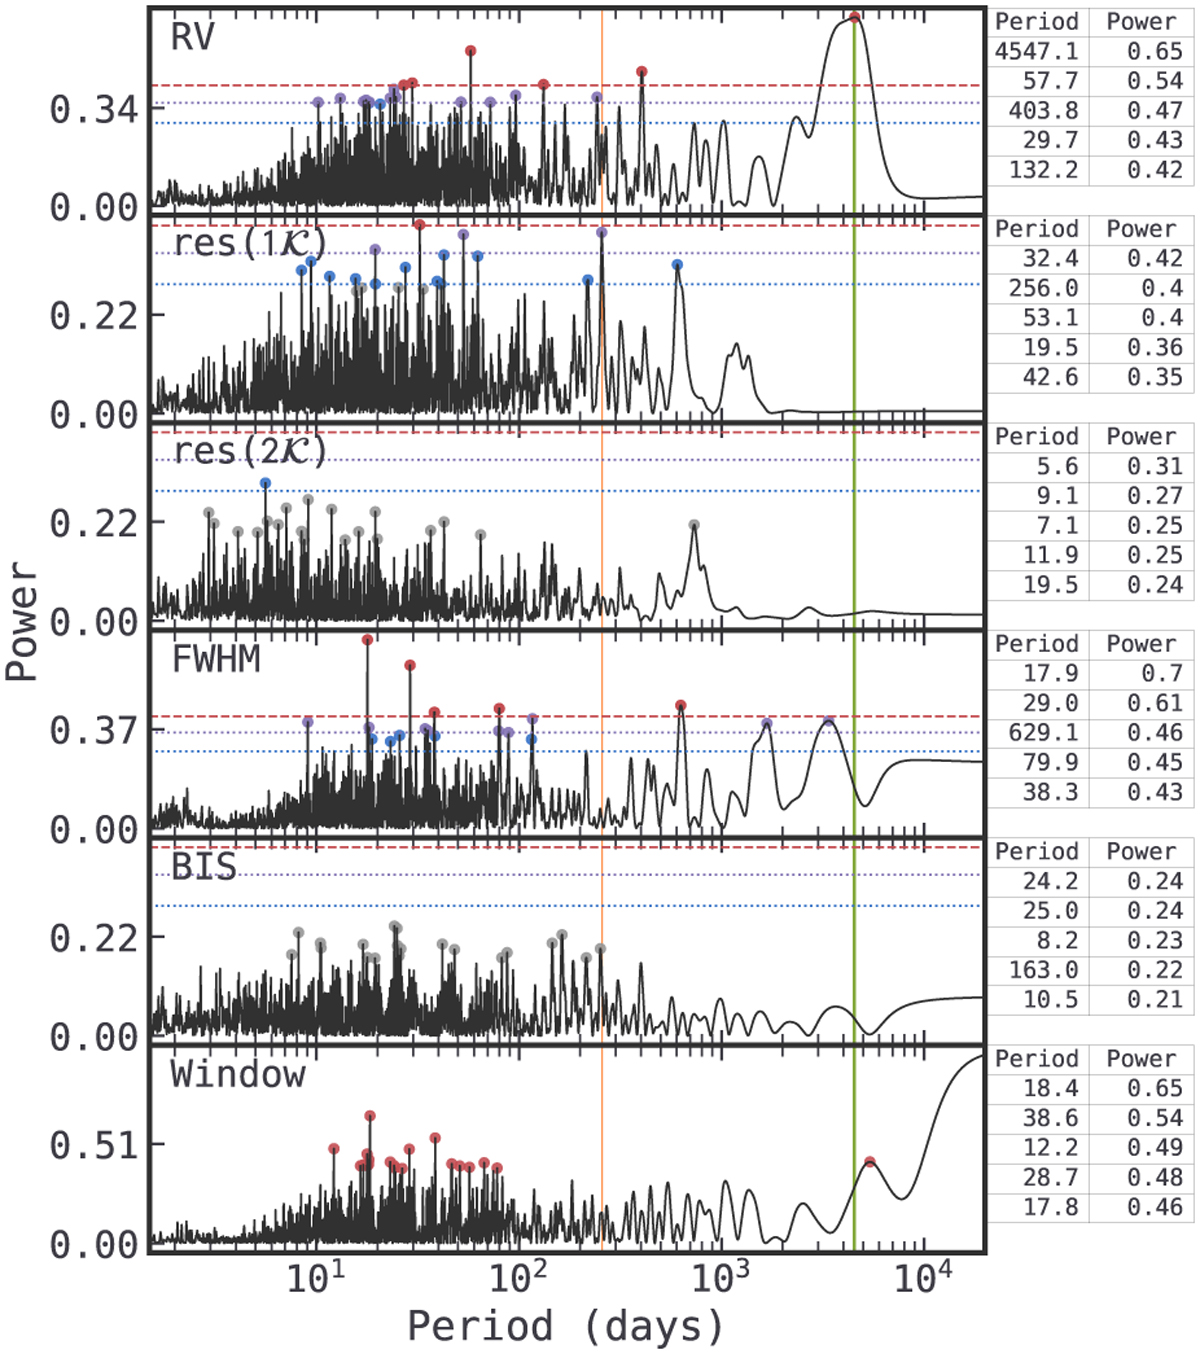
HIP39330periodograms. Shown from top to bottom: RVs, model residuals, FWHM, BIS, and window function. FAP lines for 0.1, 1, and 10%, in dashed red, dotted purple, and dotted blue, respectively. Circle markers show the periods with greatest power, coloured by FAP region. Green and orange vertical regions show P1 = ![]() d and P2 =
d and P2 = ![]() d, respectively. On the right side, a table summary with the highest powers.
d, respectively. On the right side, a table summary with the highest powers.
Current usage metrics show cumulative count of Article Views (full-text article views including HTML views, PDF and ePub downloads, according to the available data) and Abstracts Views on Vision4Press platform.
Data correspond to usage on the plateform after 2015. The current usage metrics is available 48-96 hours after online publication and is updated daily on week days.
Initial download of the metrics may take a while.