Fig. 1.
Download original image
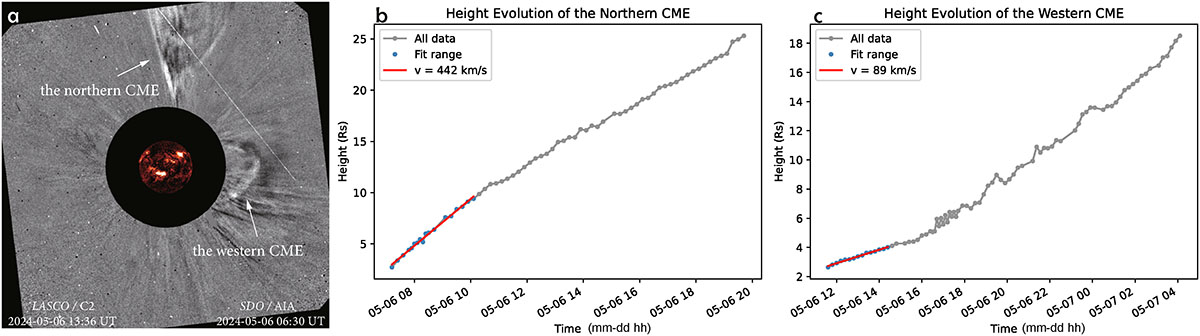
Panel (a): Two CMEs are visible in the SOHO/LASCO C2 field of view at 13:36 UT on 2024 May 6: an nCME and a wCME. The inset shows the SDO/AIA 304 Å view at 06:30 UT on the same day. Panel (b): Height evolution of the nCME. Blue dots indicate the data points used to derive the velocity, and the red line shows the linear fit with a velocity of 442 km s−1. Panel (c): Same as panel b but for the wCME, with a fitted velocity of 89 km s−1.
Current usage metrics show cumulative count of Article Views (full-text article views including HTML views, PDF and ePub downloads, according to the available data) and Abstracts Views on Vision4Press platform.
Data correspond to usage on the plateform after 2015. The current usage metrics is available 48-96 hours after online publication and is updated daily on week days.
Initial download of the metrics may take a while.