Fig. 2.
Download original image
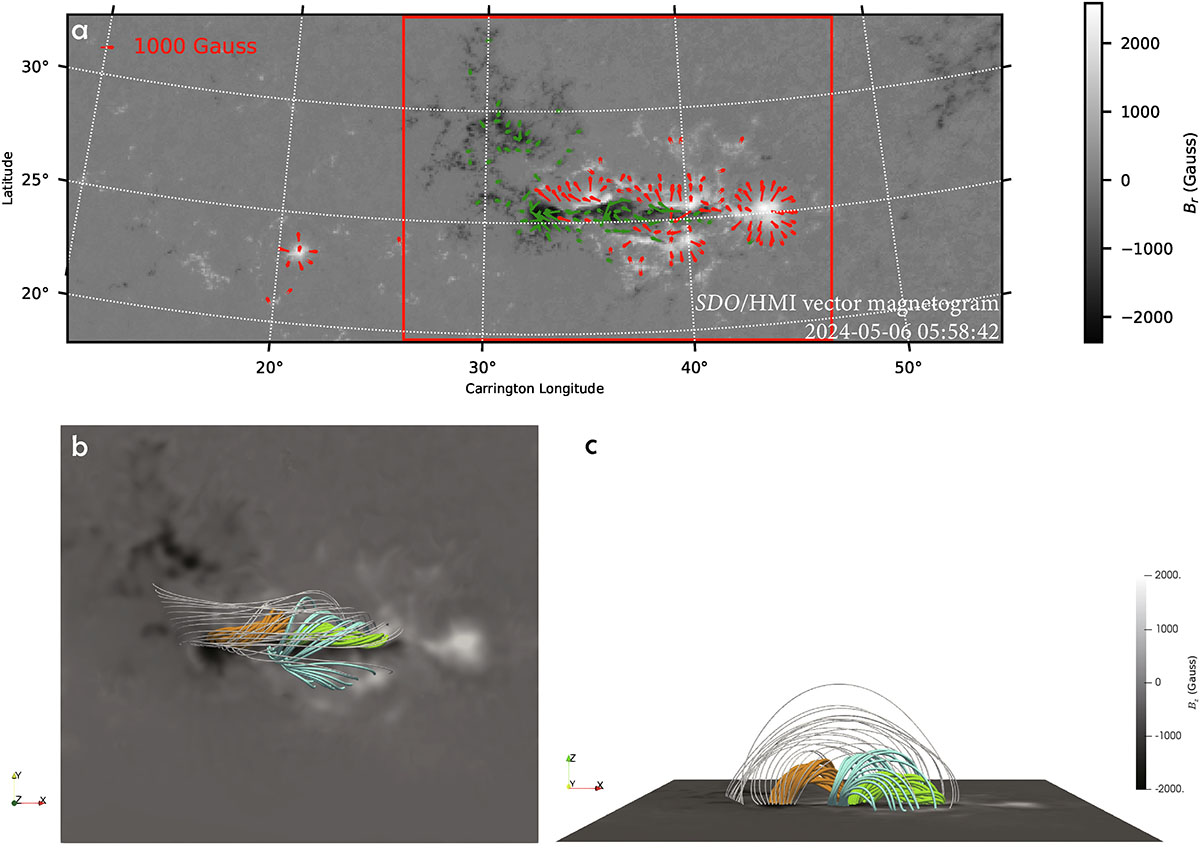
Panel (a): SDO/HMI vector magnetogram in the CEA coordinate system at 05:58 UT on 2024 May 6. The red (green) arrows represent the directions of the horizontal field in positive (negative) polarities. The region enclosed by the red rectangle is selected and processed as the bottom boundary magnetic field for the extrapolation. Panel (b): Top view of the magnetic configuration in an NLFFF model. The wFR (eFR) is colored in green (orange). The lower (higher) arcades are colored in cyan (gray). Panel (c): Side view of the same configuration as in panel b.
Current usage metrics show cumulative count of Article Views (full-text article views including HTML views, PDF and ePub downloads, according to the available data) and Abstracts Views on Vision4Press platform.
Data correspond to usage on the plateform after 2015. The current usage metrics is available 48-96 hours after online publication and is updated daily on week days.
Initial download of the metrics may take a while.