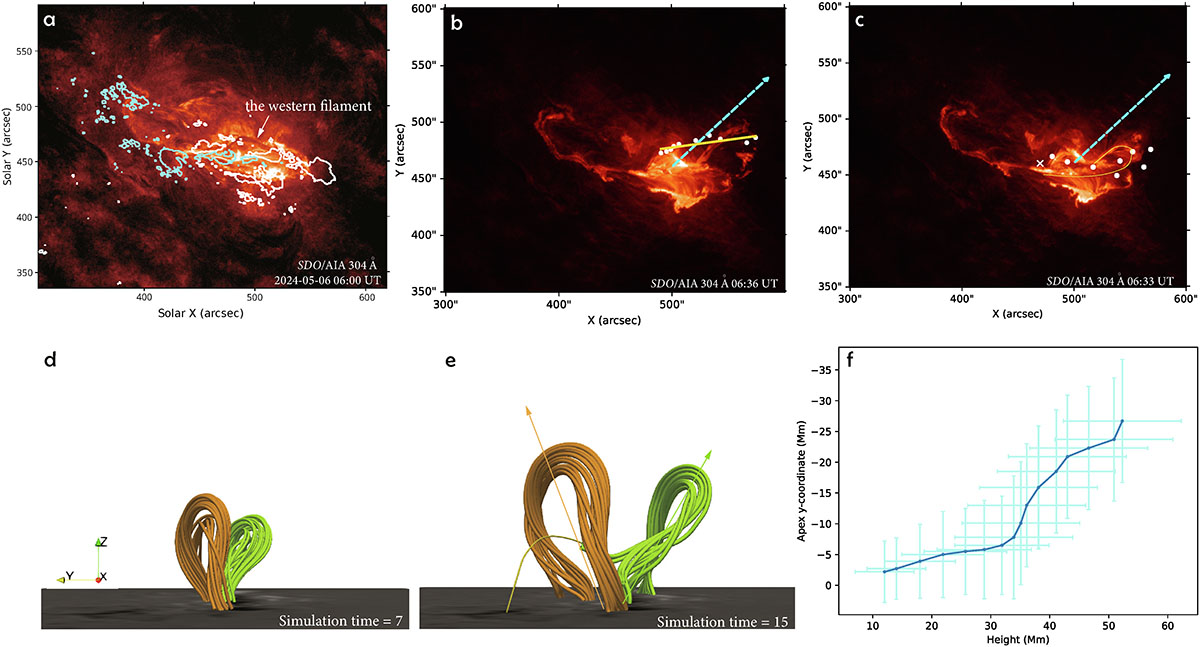
Fig. 3.
Download original image
Panel (a): SDO/AIA 304 Å image at 06:00 UT. It is covered by the white (cyan) contour of positive (negative) magnetic field in the line of sight observed by SDO/HMI. The white arrow indicates the position of the western filament. Panel (b): Comparison of the filament eruption direction and the radial direction. The white dots mark the locations of the filament apex in the AIA plane of sky at different observation times. The yellow line represents a linear fit to these points. The dashed cyan arrow indicates the radial direction projected onto the AIA view. The background shows the AIA image observed at 06:36 UT. Panel (c): Comparison of the shapes of the simulated flux rope and the observed filament. The white dots show the projected shape of the flux rope in the AIA view at simulation time t = 15, and the white cross marks the eastern footpoint of the flux rope. The yellow outline highlights the filament observed at 06:33 UT. The dashed cyan line is the same as that shown in panel b. Panel (d): Two flux ropes at simulation time t = 7. The orange (green) flux rope represents the eFR (wFR). Panel (e): Same as panel d but at simulation time t = 15. Two arrows indicate the approximate propagation directions of the flux ropes. Note that several field lines of the green flux rope are not shown completely in order to keep the image clear. A thin yellow line indicates the full shape of the partially omitted green field lines. Panel (f): Variation in the y-coordinate of the flux-rope apex as a function of height in the simulation. The light blue plus symbols at each point indicate the approximate flux-rope radius at the corresponding time.
Current usage metrics show cumulative count of Article Views (full-text article views including HTML views, PDF and ePub downloads, according to the available data) and Abstracts Views on Vision4Press platform.
Data correspond to usage on the plateform after 2015. The current usage metrics is available 48-96 hours after online publication and is updated daily on week days.
Initial download of the metrics may take a while.