Fig. 4.
Download original image
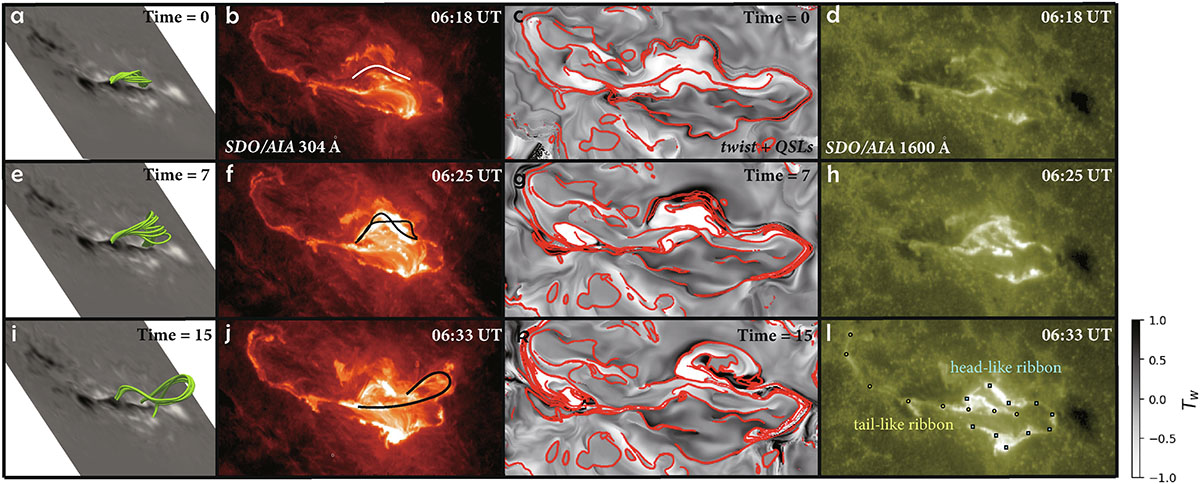
Panels (a), (e), and (i): Evolution of the wFR from an observational perspective at simulation times 0, 7, and 15, respectively. Panel (b), (f), and (j): SDO/AIA 304 Å images capturing the filament eruption at 06:18, 06:25, and 06:33 UT, respectively. The white and black lines delineate the trajectory of the filament at the respective times. Panel (c), (g), and (k): Photospheric twist distribution overlaid with red contours of QSLs (log Q = 7) at the same simulation times as panels a, e, and i, respectively. Panels (d), (h), and (l): SDO/AIA 1600 Å images illustrating the evolution of flare ribbons at the same observation times as panels b, f, and j, respectively. In panel l, the spatial distributions of tail-like ribbon and a head-like ribbon are demarcated by yellow circles and blue squares, respectively.
Current usage metrics show cumulative count of Article Views (full-text article views including HTML views, PDF and ePub downloads, according to the available data) and Abstracts Views on Vision4Press platform.
Data correspond to usage on the plateform after 2015. The current usage metrics is available 48-96 hours after online publication and is updated daily on week days.
Initial download of the metrics may take a while.