Fig. 5.
Download original image
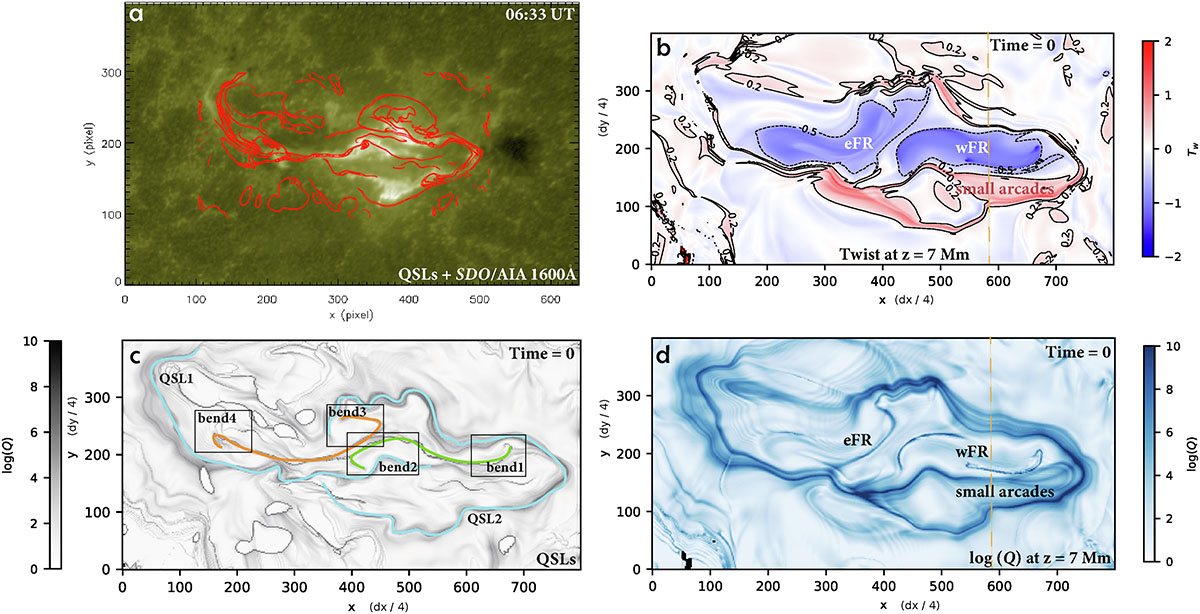
Panel (a): SDO/AIA 1600 Å image at 06:33 UT overlaid with QSLs in red contours at simulation time = 15. Panel (b): Twist distribution at z = 7 Mm at simulation time = 0. The positions of the eFR, wFR, and small arcades are marked. The dashed and solid black lines represent the twist = −0.5 and twist = 0.2 contours, respectively. The dashed orange line shows the slice location in Figs. 6a and 6b. Panel (c): log (Q) distribution at z = 0 at simulation time = 0, with high-Q regions highlighted in color. Blue lines mark the locations of the short tail-like ribbon and the head-like ribbon, while orange and green lines mark two S-shaped ribbons. Black rectangles denote the positions of four bends, which correspond to hooks observed in flare ribbons. Panel (d): log (Q) distribution at z = 7 Mm at simulation time = 0 with same markers as in panel b. The pixel size in panels b–d is dx/4 = dy/4 = 175 km, where dx = dy = 700 km is the spatial resolution of the simulation.
Current usage metrics show cumulative count of Article Views (full-text article views including HTML views, PDF and ePub downloads, according to the available data) and Abstracts Views on Vision4Press platform.
Data correspond to usage on the plateform after 2015. The current usage metrics is available 48-96 hours after online publication and is updated daily on week days.
Initial download of the metrics may take a while.