Fig. 6.
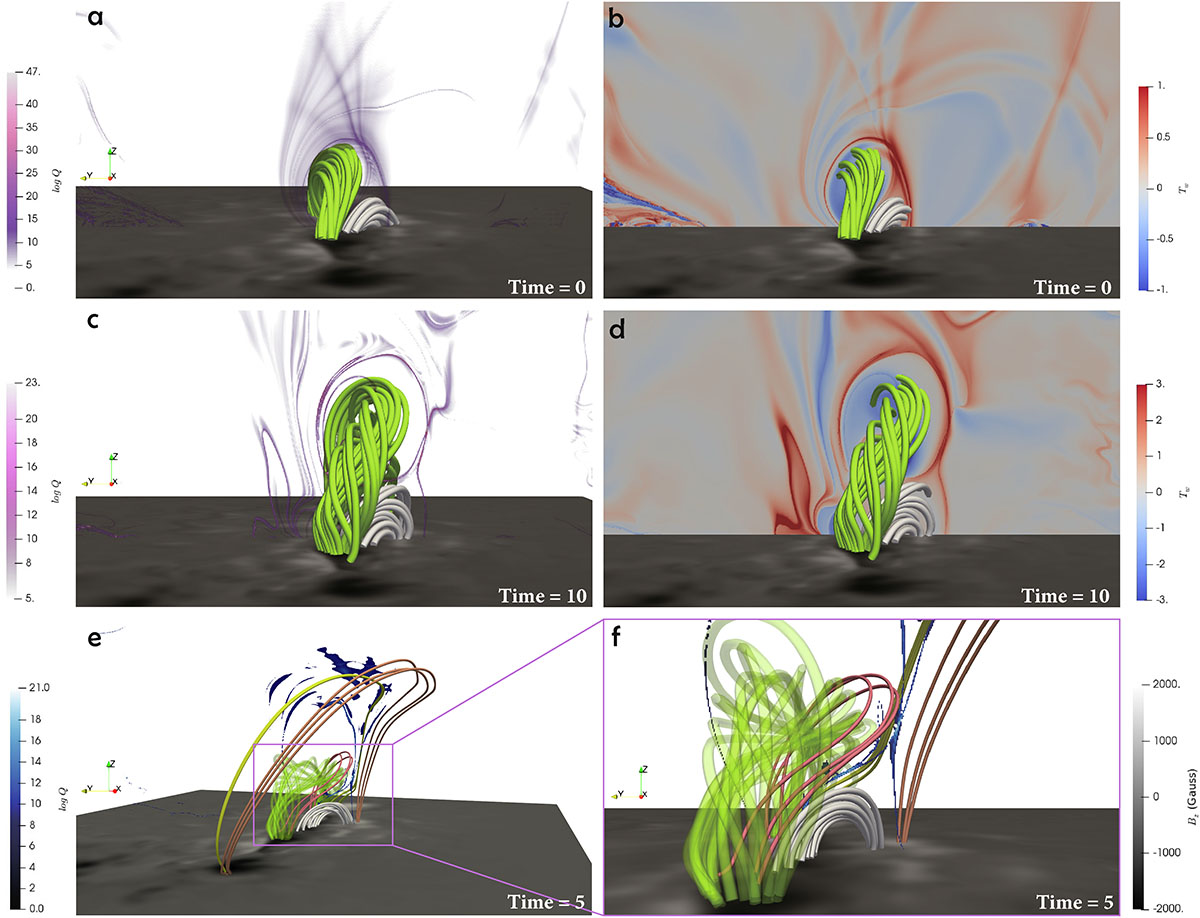
Download original image
Panel (a): Magnetic configuration of two current channels at simulation time = 0. The wFR is colored in green, and the small arcade in gray. The semitransparent slice shows the QSL distribution. Panel (b): Same magnetic configuration as panel a, but the slice shows a twist distribution. The slice is at x = 31.4 Mm. Panel (c): Same as panel a but at simulation time = 10. Panel (d): Same as panel b but at simulation time = 10. The slices shown in panels c and d are taken at x = 20.0 Mm. Panel (e): Magnetic configuration around the X-point. The dark blue patches represent QSL contours. The semitransparent green flux rope corresponds to the wFR, with several of its peripheral field lines highlighted in red. The small arcade and the several field lines formed through reconnection are depicted in gray. Two sets of external field lines are shown in orange and yellow, respectively. Panel (d): Zoomed-in view of the configuration shown in panel c.
Current usage metrics show cumulative count of Article Views (full-text article views including HTML views, PDF and ePub downloads, according to the available data) and Abstracts Views on Vision4Press platform.
Data correspond to usage on the plateform after 2015. The current usage metrics is available 48-96 hours after online publication and is updated daily on week days.
Initial download of the metrics may take a while.