Fig. 7.
Download original image
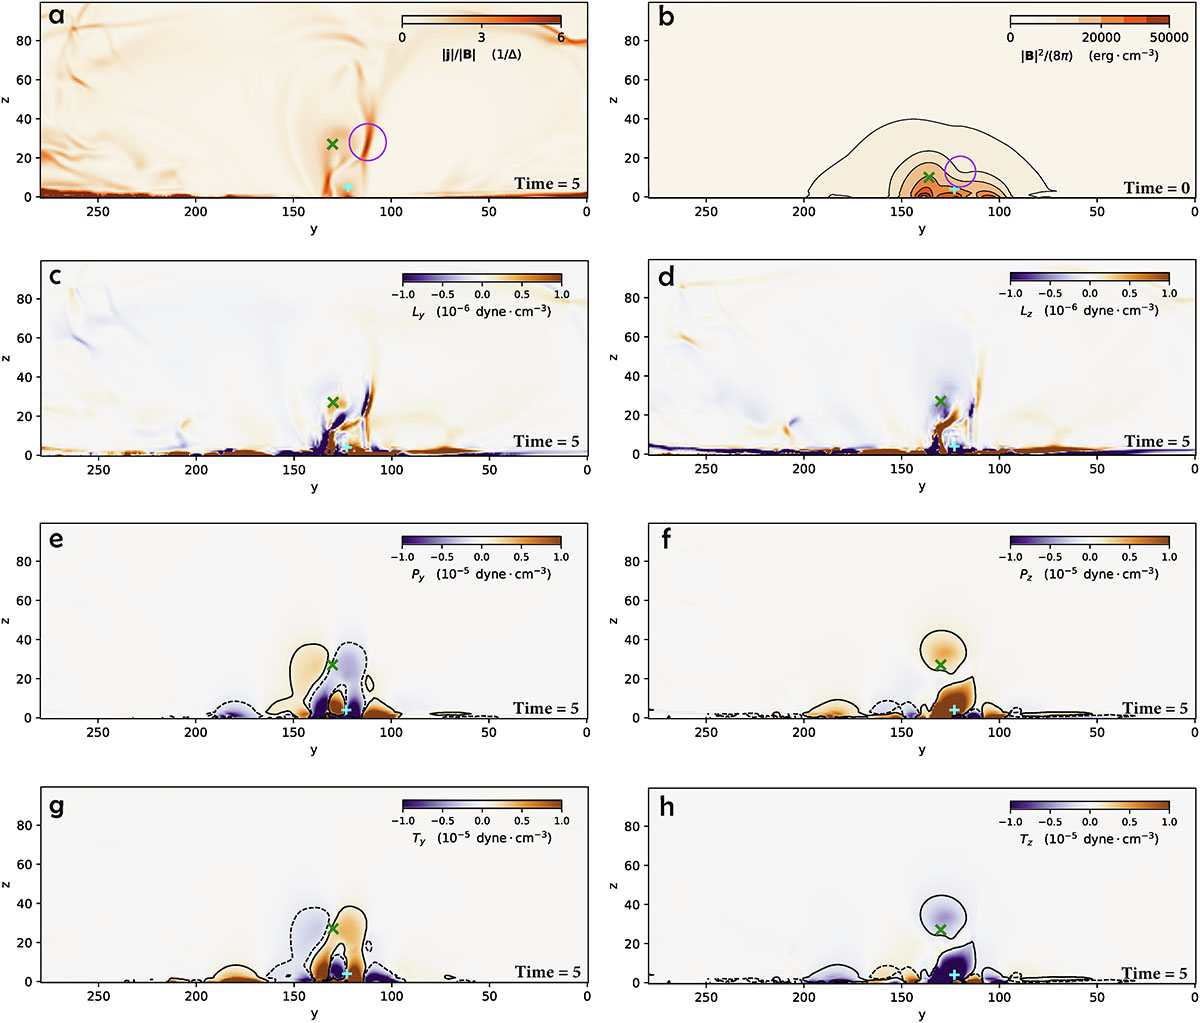
Panel (a): Distribution of |j|/|B| on a slice at x = 30.7 Mm. The purple circle marks the position of the current sheet at the X-point. Panel (b): Magnetic energy density at simulation time = 0. The purple circle marks the region of lower magnetic energy density near the flux rope. Panel (c): Lorentz force in the y direction. Panel (d): Lorentz force in the z direction. Panel (e): Magnetic pressure in the y direction. Panel (f): Magnetic pressure in the z direction. Panel (g): Magnetic tension force in the y direction. Panel (h): Magnetic tension force in the z direction. All panels show the physical quantity distribution on the same slice as Figs. 6a and 6b. Except panel b, all panels show the quantity distribution at simulation time = 5. The green cross marks the location of the wFR’s axis, and the cyan plus sign indicates the position of the small arcade. Note that the y-axis is reversed to facilitate comparison with Fig. 6.
Current usage metrics show cumulative count of Article Views (full-text article views including HTML views, PDF and ePub downloads, according to the available data) and Abstracts Views on Vision4Press platform.
Data correspond to usage on the plateform after 2015. The current usage metrics is available 48-96 hours after online publication and is updated daily on week days.
Initial download of the metrics may take a while.