Fig. D.1
Download original image
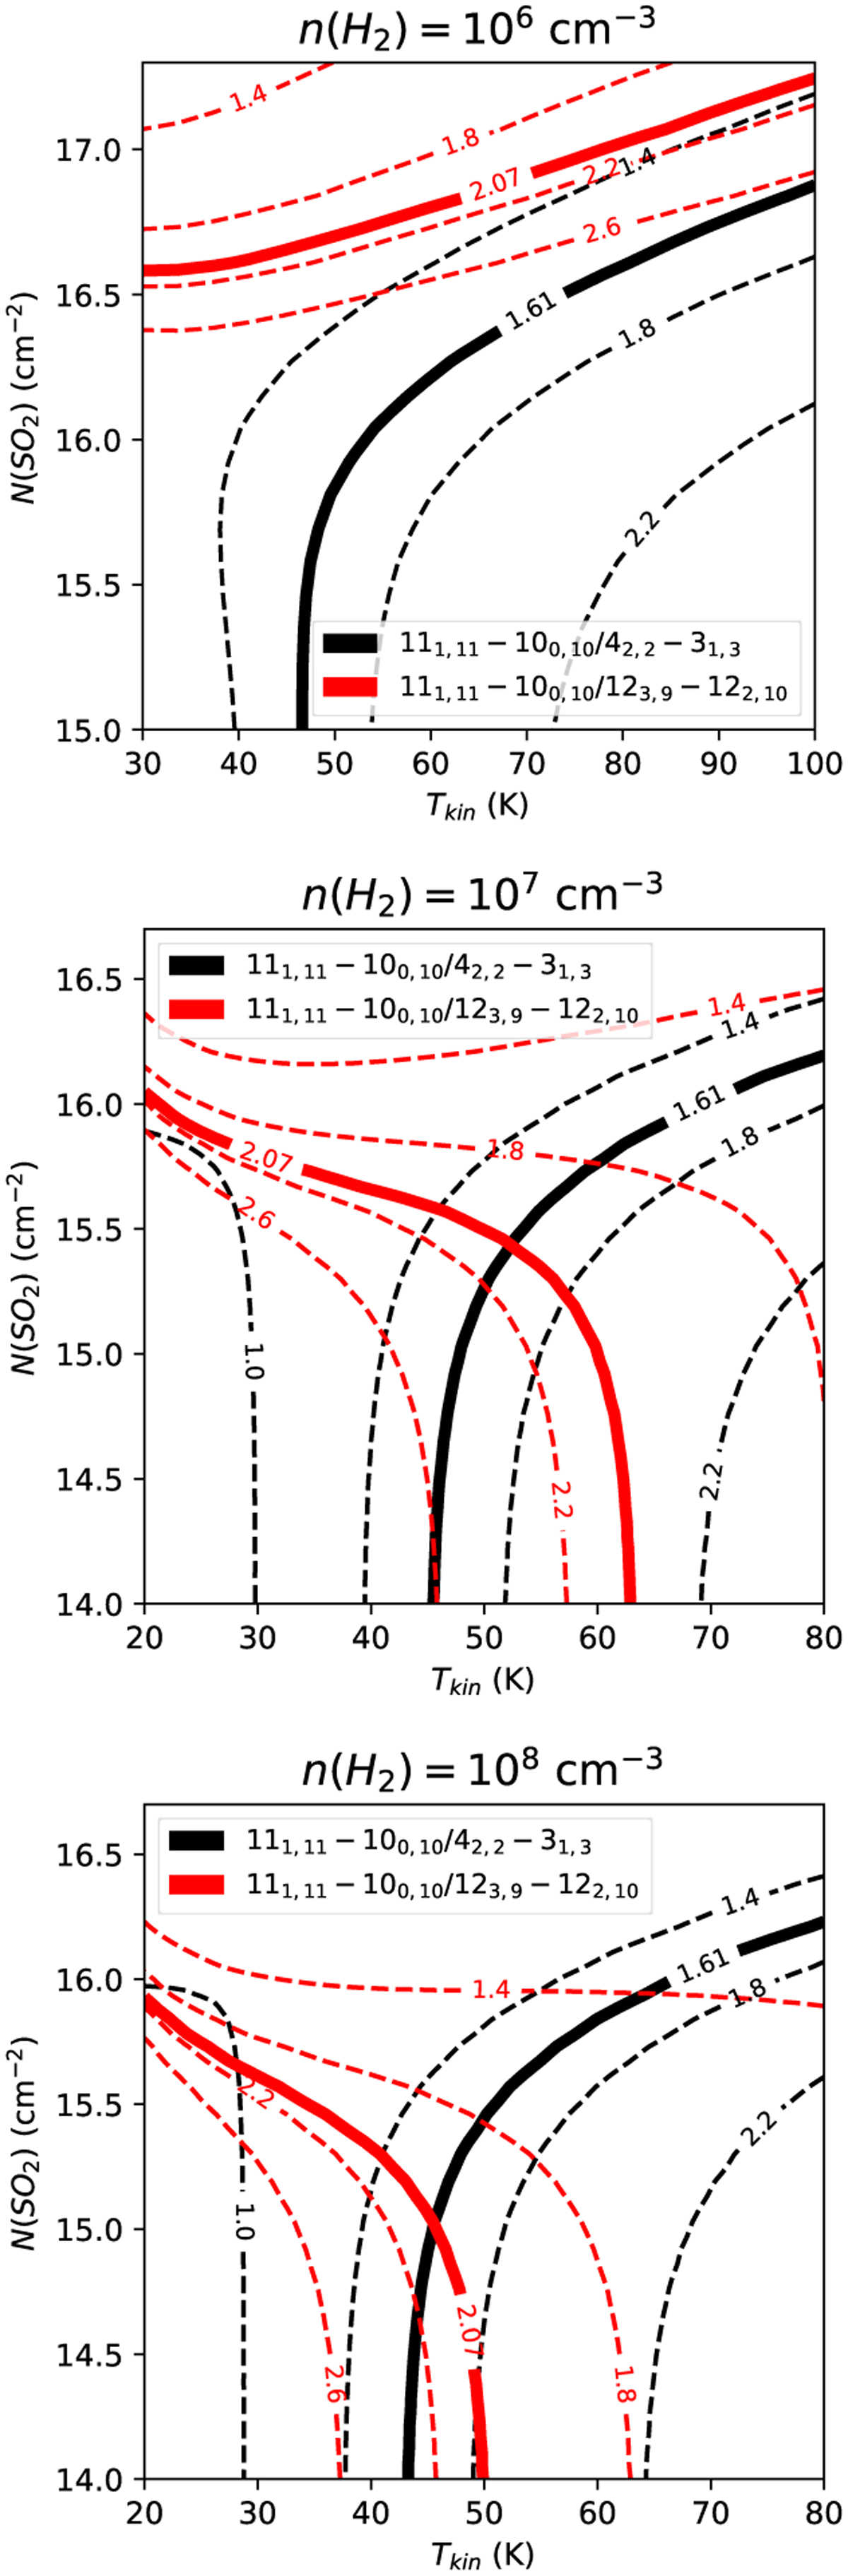
Line ratios between SO2 111,11 − 100,10, 42,2 − 31,3 and 123,9 − 122,10 transitions resulting from different combinations of Tkin − N(SO2) obtained with RADEX. Black lines show the resulting 111,11–100,10 over 42,2–31,3 line ratio, whereas red lines show the 111,11–100,10 over 123,9–122,10 line ratio. The thick black and red lines mark the line ratios found in the spectra of peak 2. The dashed black and red lines indicate where other line ratio values are located in the grid. Top: results for nH2 = 106 cm−3. Middle: results for nH2 = 107 cm−3. Bottom: results for nH2 = 108 cm−3.
Current usage metrics show cumulative count of Article Views (full-text article views including HTML views, PDF and ePub downloads, according to the available data) and Abstracts Views on Vision4Press platform.
Data correspond to usage on the plateform after 2015. The current usage metrics is available 48-96 hours after online publication and is updated daily on week days.
Initial download of the metrics may take a while.