Fig. 1
Download original image
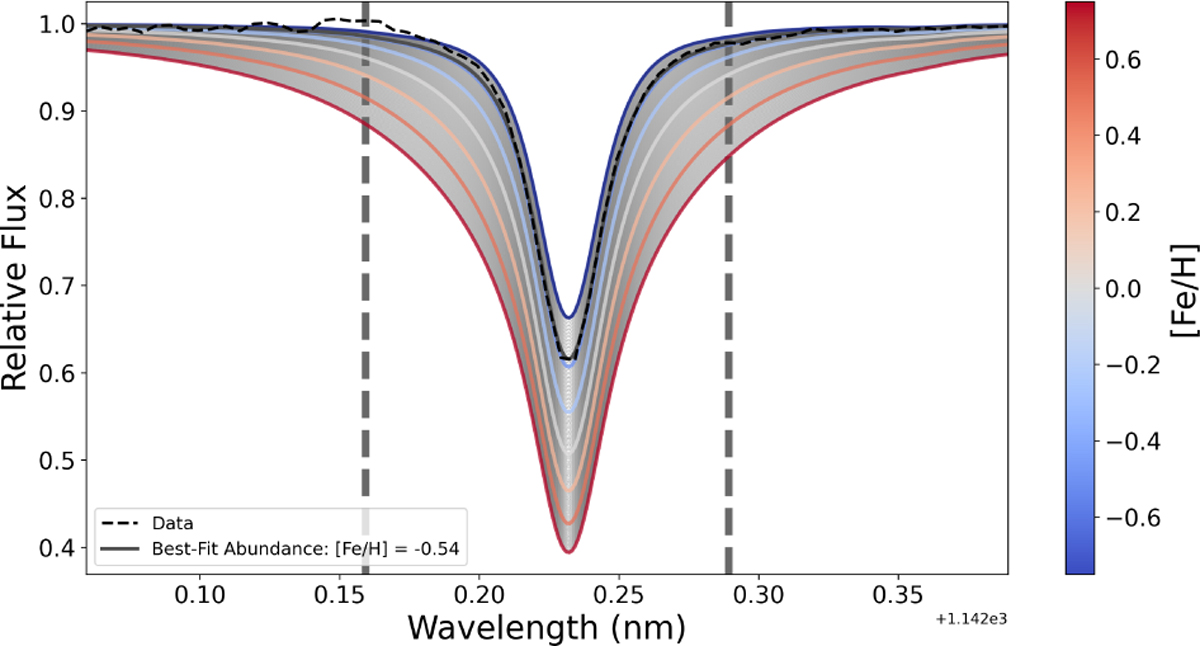
Model fit to the 1142.2 nm refractory Fe I line for star HD 260655. The colored lines represent different synthetic spectra, and the fainter gray lines represent the interpolated grid of spectra that was fit to the data, shown as a black dashed line. The best-fit abundance of [Fe/H] = −0.54 is shown as a darker gray line. It tracks the data over the line region very closely, and is delineated on either side by dashed gray lines.
Current usage metrics show cumulative count of Article Views (full-text article views including HTML views, PDF and ePub downloads, according to the available data) and Abstracts Views on Vision4Press platform.
Data correspond to usage on the plateform after 2015. The current usage metrics is available 48-96 hours after online publication and is updated daily on week days.
Initial download of the metrics may take a while.