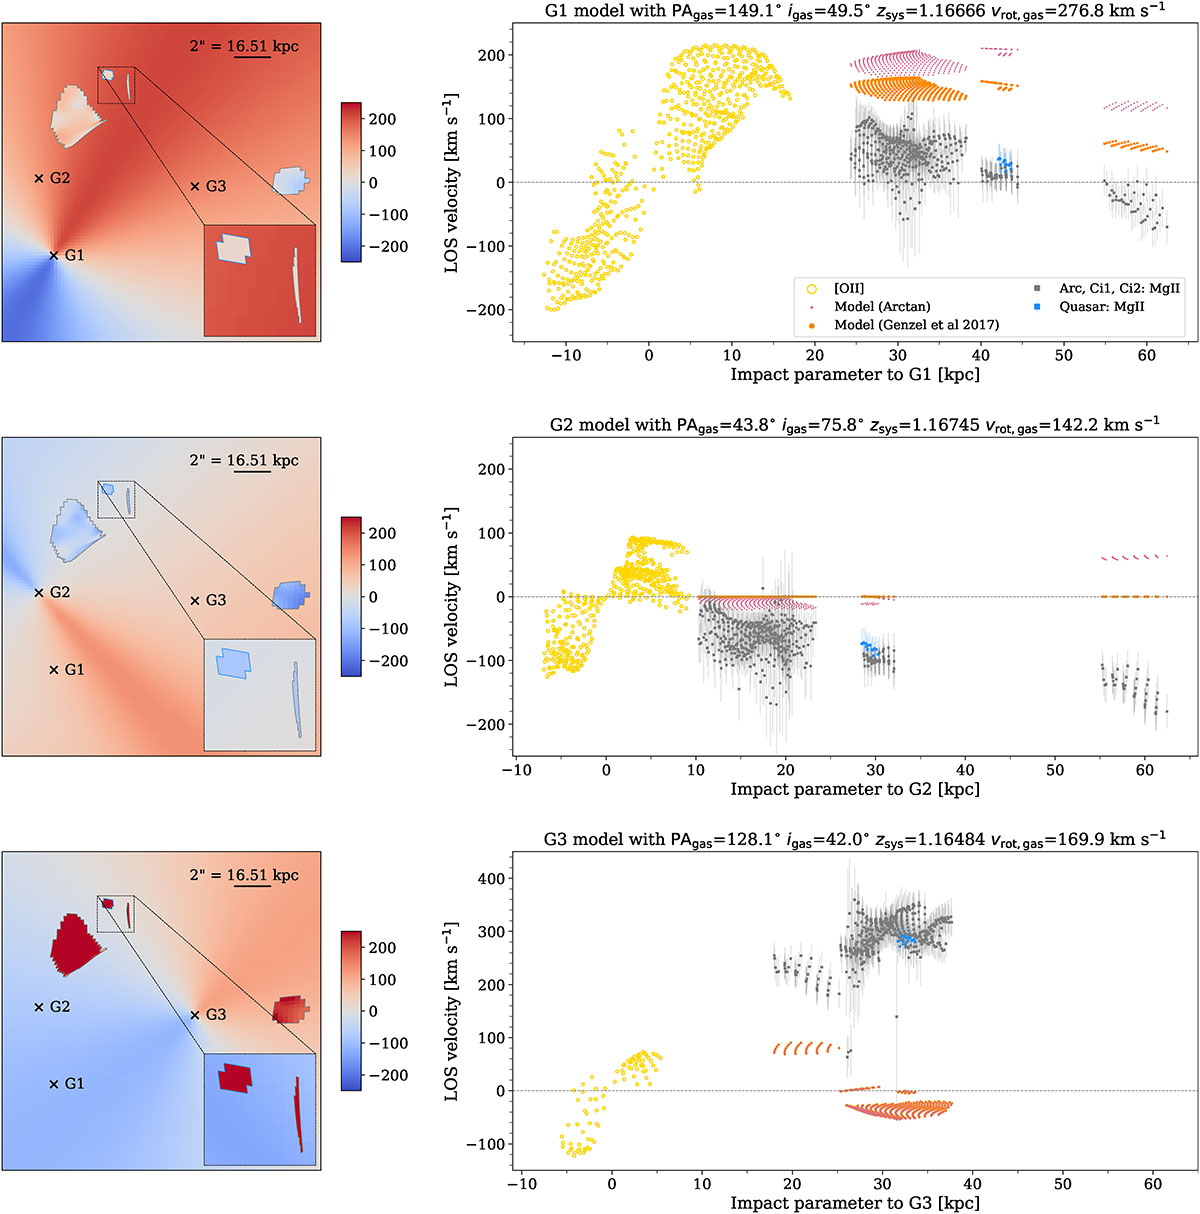
Fig. D.3.
Download original image
Single extended rotating disc models for G1, G2, and G3 (top, middle, and bottom panels, respectively) based on extrapolations of their [O II] kinematics. Left panels: Modelled velocity maps assuming arctangent rotation curves. The observed intervening Mg II mean velocities are overlaid for each of the four delensed sources. The inset shows a zoom-in on a region encompassing Ci1 and the quasar. Right panels: Model-predicted velocities for both the arctangent and realistic rotation curves (in pink and orange, respectively) at the positions of the Arc, Ci1, Ci2, and the quasar as a function of impact parameter relative to the galaxy. The observed Mg II velocities are displayed in black for the Arc, Ci1, and Ci2, and the blue lines and squares are for the quasar.
Current usage metrics show cumulative count of Article Views (full-text article views including HTML views, PDF and ePub downloads, according to the available data) and Abstracts Views on Vision4Press platform.
Data correspond to usage on the plateform after 2015. The current usage metrics is available 48-96 hours after online publication and is updated daily on week days.
Initial download of the metrics may take a while.