Fig. 3.
Download original image
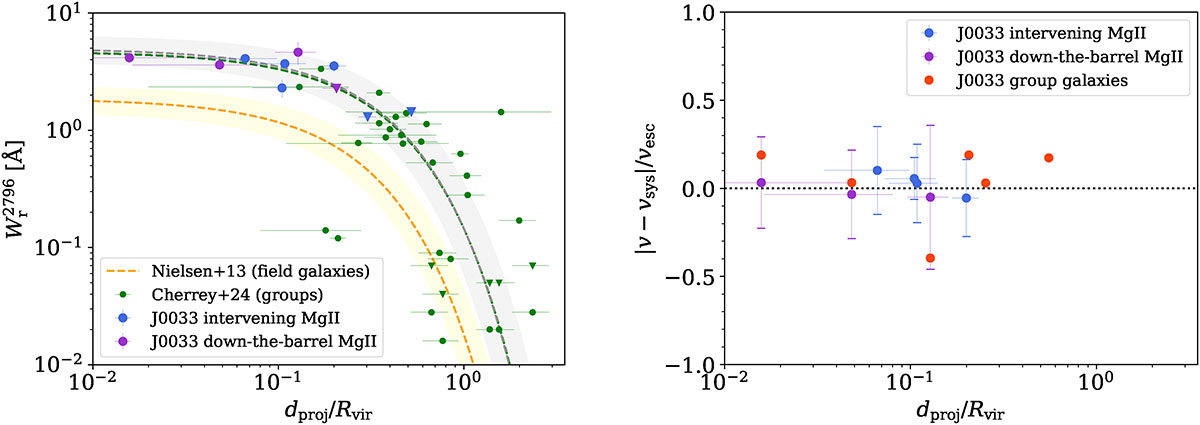
Left panel: Rest-frame equivalent width of Mg IIλ2796 as a function of the projected distance from the group’s barycentre, normalised by the group’s virial radius. Our measurements are compared to the galaxy group sample from Cherrey et al. (2024). The overall best-fit relation for the intervening Mg II absorption is displayed as a dashed grey line along with its 1σ confidence region. The original relation from Cherrey et al. (2024) is shown in green. Right panel: Velocity span of the Mg II profiles, Δv ± σv, normalised by the group’s escape velocity, vesc = 601 km s−1, as a function of the normalised projected distance from the group’s barycentre. The velocities of the individual galaxies are shown in red. The reference velocity, vsys, is the mass-weighted mean redshift of the group (zsys = 1.16663).
Current usage metrics show cumulative count of Article Views (full-text article views including HTML views, PDF and ePub downloads, according to the available data) and Abstracts Views on Vision4Press platform.
Data correspond to usage on the plateform after 2015. The current usage metrics is available 48-96 hours after online publication and is updated daily on week days.
Initial download of the metrics may take a while.